

In vivo imaging and quantitative analysis of changes in axon length using transgenic zebrafish embryos
- PMID: 21903162
- PMCID: PMC6007021
- DOI: 10.1016/j.ntt.2011.08.013
In vivo imaging and quantitative analysis of changes in axon length using transgenic zebrafish embryos
Abstract
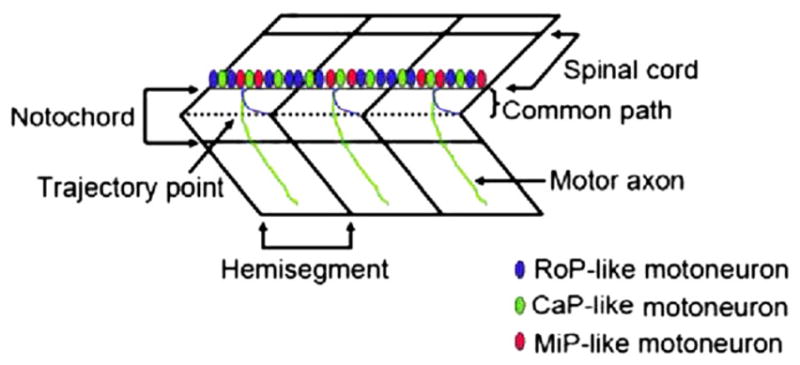
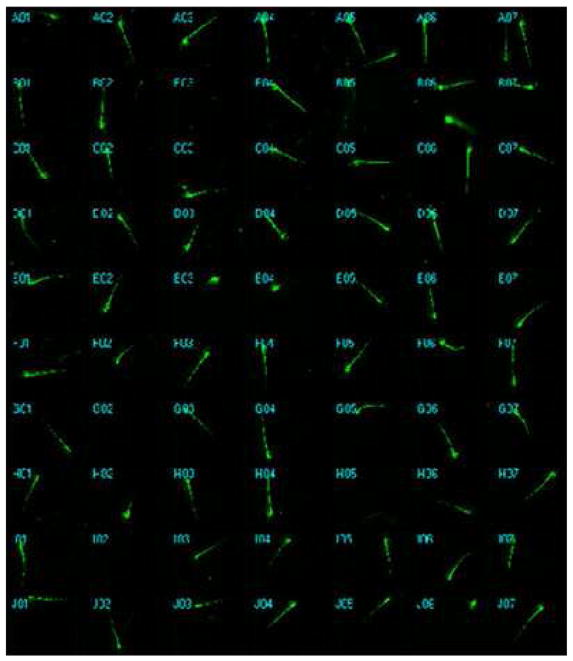
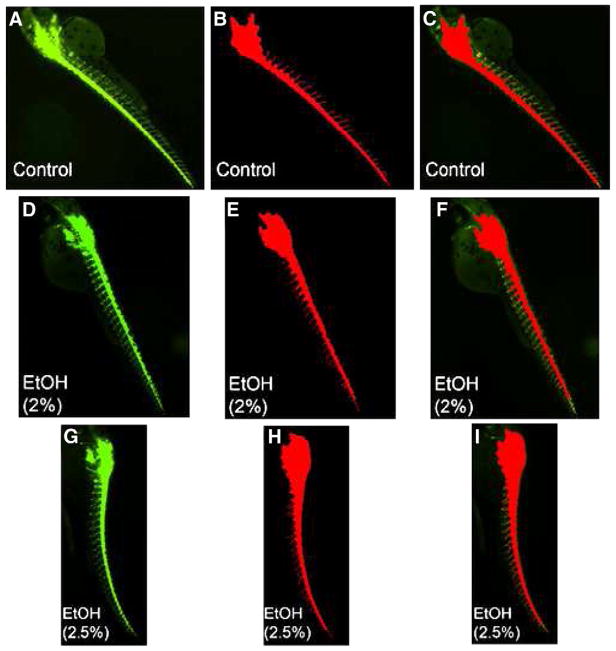
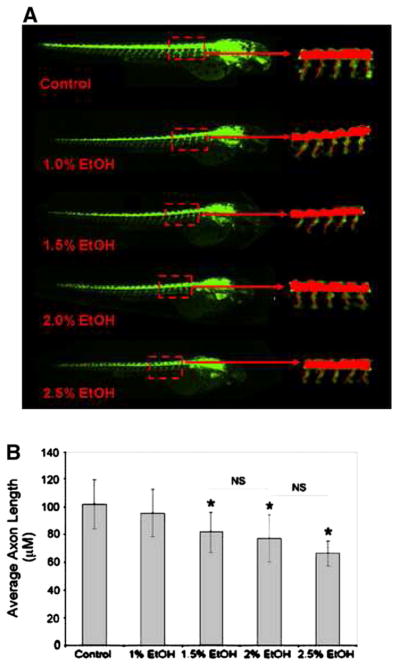
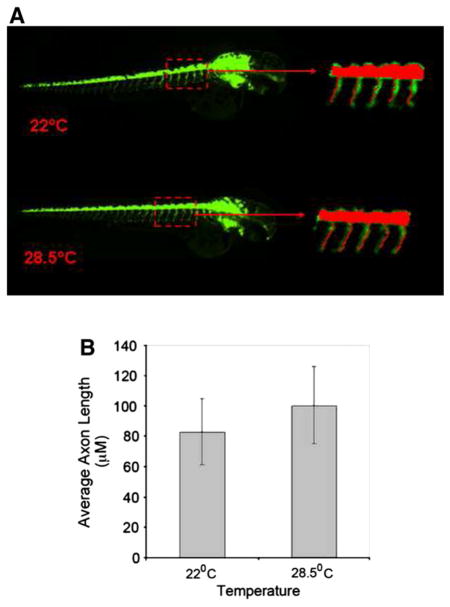
We describe an imaging procedure to measure axon length in zebrafish embryos in vivo. Automated fluorescent image acquisition was performed with the ImageXpress Micro high content screening reader and further analysis of axon lengths was performed on archived images using AcuityXpress software. We utilized the Neurite Outgrowth Application module with a customized protocol (journal) to measure the axons. Since higher doses of ethanol (2-2.5%, v/v) have been shown to deform motor neurons and axons during development, here we used ethanol to treat transgenic [hb9:GFP (green fluorescent protein)] zebrafish embryos at 28 hpf (hours post-fertilization). These embryos express GFP in the motor neurons and their axons. Embryos after ethanol treatment were arrayed in 384-well plates for automated fluorescent image acquisition in vivo. Average axon lengths of high dose ethanol-treated embryos were significantly lower than the control. Another experiment showed that there was no significant difference in the axon lengths between the embryos grown for 24h at 22°C and 28.5°C. These test experiments demonstrate that using axon development as an end-point, compound screening can be performed in a time-efficient manner.
Published by Elsevier Inc.
Conflict of interest statement
Nothing declared.
Figures
Similar articles
-
Developmental toxicity assay using high content screening of zebrafish embryos.J Appl Toxicol. 2015 Mar;35(3):261-72. doi: 10.1002/jat.3029. Epub 2014 May 28. J Appl Toxicol. 2015. PMID: 24871937 Free PMC article.
-
Development of automated imaging and analysis for zebrafish chemical screens.J Vis Exp. 2010 Jun 24;(40):1900. doi: 10.3791/1900. J Vis Exp. 2010. PMID: 20613708 Free PMC article.
-
Prdm14 acts upstream of islet2 transcription to regulate axon growth of primary motoneurons in zebrafish.Development. 2012 Dec;139(24):4591-600. doi: 10.1242/dev.083055. Epub 2012 Nov 7. Development. 2012. PMID: 23136389
-
Transgenic fish systems and their application in ecotoxicology.Crit Rev Toxicol. 2015 Feb;45(2):124-41. doi: 10.3109/10408444.2014.965805. Epub 2014 Nov 14. Crit Rev Toxicol. 2015. PMID: 25394772 Review.
-
Fluorescent proteins in zebrafish cell and developmental biology.Methods Cell Biol. 2008;85:219-41. doi: 10.1016/S0091-679X(08)85010-8. Methods Cell Biol. 2008. PMID: 18155465 Review.
Cited by
-
Development of a convenient in vivo hepatotoxin assay using a transgenic zebrafish line with liver-specific DsRed expression.PLoS One. 2014 Mar 13;9(3):e91874. doi: 10.1371/journal.pone.0091874. eCollection 2014. PLoS One. 2014. PMID: 24626481 Free PMC article.
-
Developmental toxicity assay using high content screening of zebrafish embryos.J Appl Toxicol. 2015 Mar;35(3):261-72. doi: 10.1002/jat.3029. Epub 2014 May 28. J Appl Toxicol. 2015. PMID: 24871937 Free PMC article.
-
Zebrafish: A marvel of high-throughput biology for 21st century toxicology.Curr Environ Health Rep. 2014 Sep 7;1(4):341-352. doi: 10.1007/s40572-014-0029-5. Curr Environ Health Rep. 2014. PMID: 25678986 Free PMC article.
-
Zebrafish: A Model for the Study of Toxicants Affecting Muscle Development and Function.Int J Mol Sci. 2016 Nov 19;17(11):1941. doi: 10.3390/ijms17111941. Int J Mol Sci. 2016. PMID: 27869769 Free PMC article. Review.
-
A versatile, automated and high-throughput drug screening platform for zebrafish embryos.Biol Open. 2021 Sep 15;10(9):bio058513. doi: 10.1242/bio.058513. Epub 2021 Sep 2. Biol Open. 2021. PMID: 34472582 Free PMC article.
References
-
- Arenzana FJ, Carvan MJ, III, Aijon J, Sanchez-Gonzalez R, Arevalo R, Porteros A. Teratogenic effects of ethanol exposure on zebrafish visual system development. Neurotoxicol Teratol. 2006;28:342–8. - PubMed
-
- Bilotta J, Barnett JA, Hancock L, Saszik S. Ethanol exposure alters zebrafish development: a novel model of fetal alcohol syndrome. Neurotoxicol Teratol. 2004;26:737–43. - PubMed
-
- Bretaud S, Lee S, Guo S. Sensitivity of zebrafish to environmental toxins implicated in Parkinson’s disease. Neurotoxicol Teratol. 2004;26:857–64. - PubMed
-
- Carvan MJ, III, Loucks E, Weber DN, Williams FE. Ethanol effects on the developing zebrafish: neurobehavior and skeletal morphogenesis. Neurotoxicol Teratol. 2004;26:757–68. - PubMed
Publication types
MeSH terms
Substances
Grants and funding
LinkOut - more resources
Full Text Sources
Molecular Biology Databases
