. 2011 Sep 23;35(3):413-25.
doi: 10.1016/j.immuni.2011.06.013. Epub 2011 Sep 8.

Multilineage priming of enhancer repertoires precedes commitment to the B and myeloid cell lineages in hematopoietic progenitors

Affiliations

Multilineage priming of enhancer repertoires precedes commitment to the B and myeloid cell lineages in hematopoietic progenitors

Elinore M Mercer et al. Immunity. .

Abstract

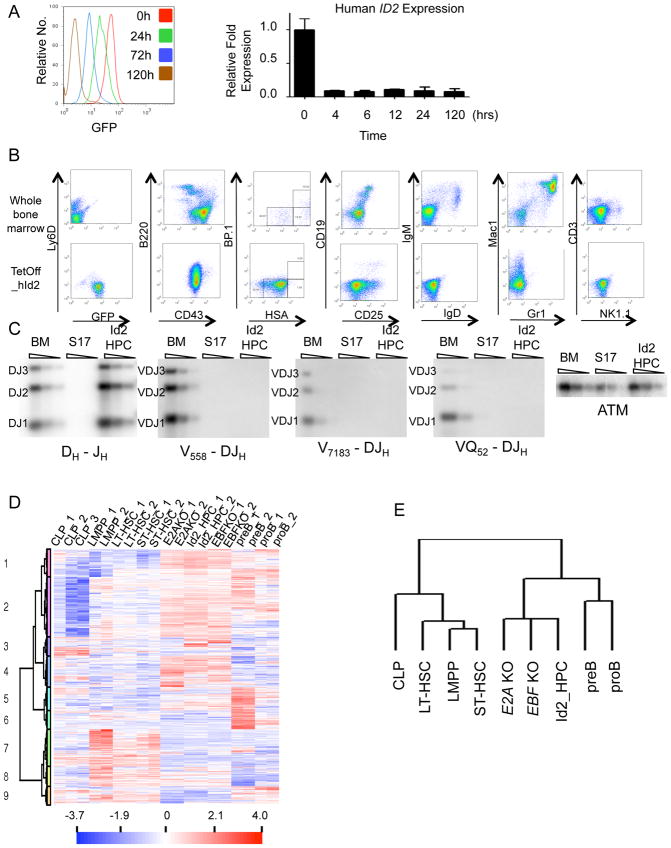
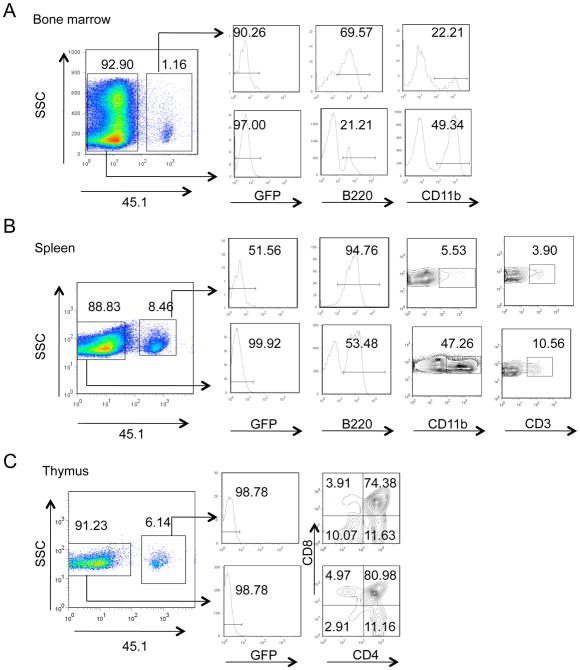
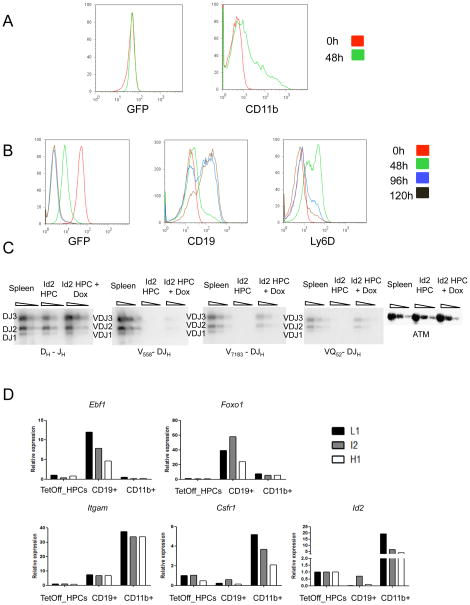
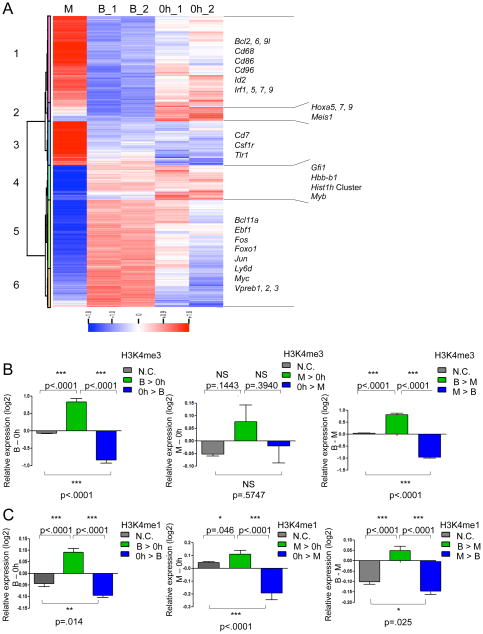
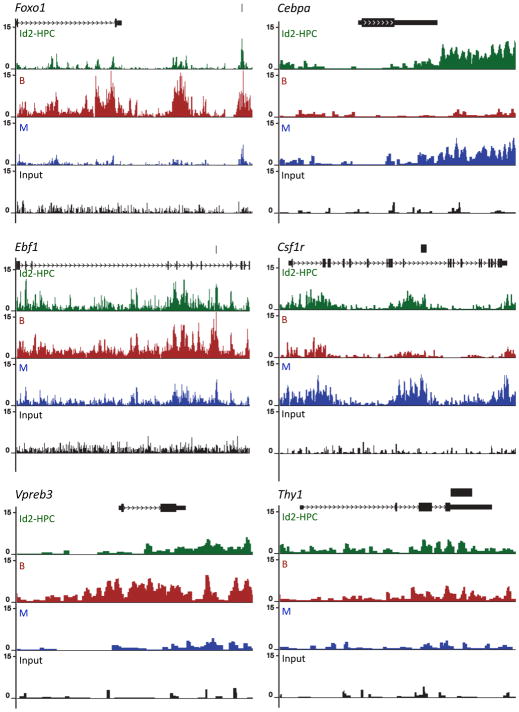
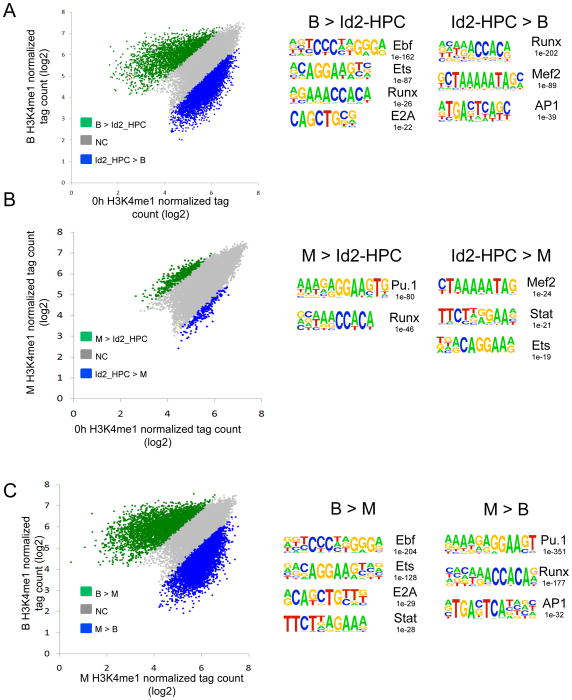
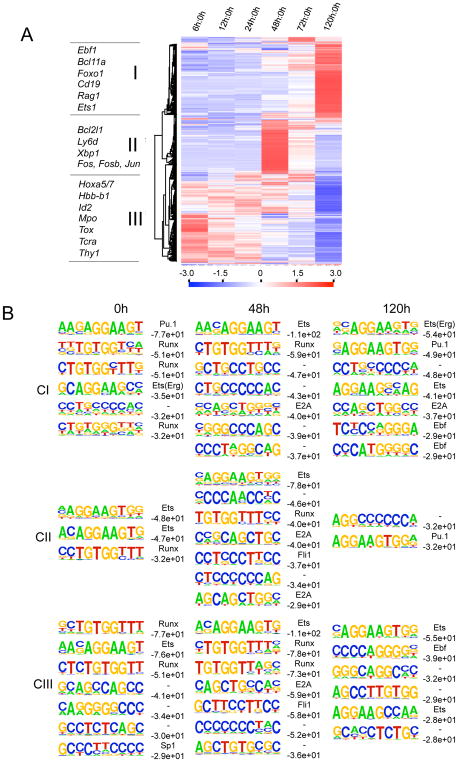
Recent studies have documented genome-wide binding patterns of transcriptional regulators and their associated epigenetic marks in hematopoietic cell lineages. In order to determine how epigenetic marks are established and maintained during developmental progression, we have generated long-term cultures of hematopoietic progenitors by enforcing the expression of the E-protein antagonist Id2. Hematopoietic progenitors that express Id2 are multipotent and readily differentiate upon withdrawal of Id2 expression into committed B lineage cells, thus indicating a causative role for E2A (Tcf3) in promoting the B cell fate. Genome-wide analyses revealed that a substantial fraction of lymphoid and myeloid enhancers are premarked by the poised or active enhancer mark H3K4me1 in multipotent progenitors. Thus, in hematopoietic progenitors, multilineage priming of enhancer elements precedes commitment to the lymphoid or myeloid cell lineages.


Figures

Figure 1
Figure 1. Establishment of a Long-Term Culture of Multipotent Hematopoietic Progenitors
(A) Rapid and robust downregulation of GFP and human ID2 after doxycycline addition in vitro. FACS plots of GFP (left panel) at 0, 24, 72 and 120 hour post-doxycycline addition are shown. Real-time PCR analysis of human ID2 expression at 0, 4, 6, 12, 24 and 120-hour post-doxycycline addition. (B) Phenotypic analysis of Id2-HPC cells. TetOff_hId2 infected cells were cultured on S17 feeder cells with IL-7, SCF and Flt3L. Cells were analyzed by FACS for the expression of B220, Ly6D, CD43, CD25, CD19, Mac1, Gr1, CD3 and NK1.1 after 3 months in culture. The upper panel shows staining from wild type bone marrow as controls and the lower panel shows staining from expanded Id2-HPCs in the absence of doxycycline. (C) IgH gene rearrangement analysis of Id2-HPCs. DNA was isolated from wild type bone marrow, S17 feeder cells, and TetOff_hId2 cells and analyzed by Southern Blot for the presence of IgH DJ and V-DJ rearrangements. ATM was used as a loading control. (D) Microarray analysis of LT-HSCs, ST-HSCs, LMPPs, CLPs, pre-B cells, pro-B cells, Tcf3−/− cell line, Ebf1−/− cell line, and Id2-HPC cell line. Duplicate genes have been removed. The color scale is shown below the diagram. (E) Vertical clustering of cell types from microarray experiment in Figure 1D.
Figure 2
Figure 2. Id2-HPCs Reconstitute Multiple Lineages in vivo and in vitro
Id2-HPCs can reconstitute multiple lineages in irradiated recipients. A competitive reconstitution assay was used to assess the ability of Id2-HPCs to reconstitute irradiated recipients. One million Id2-HPCs and one million freshly isolated wild type bone marrow cells were injected into lethally irradiated recipients receiving doxycycline feed. Reconstitution was analyzed 6 weeks later. The data is representative of two experiments. (A) Id2-HPCs successfully reconstitute the bone marrow of recipients. Bone marrow cells were analyzed by FACS analysis for expression of GFP, B220 and CD11b. (B) Id2-HPCs successfully reconstitute the spleen of recipients. Bone marrow cells were analyzed by FACS analysis for expression of GFP, B220, CD11b and CD3. (C) Id2-HPCs successfully reconstitute the thymus of recipients. Bone marrow cells were analyzed by FACS analysis for expression of GFP, CD4 and CD8.
Figure 3
Figure 3. In vitro Differentiation Potential of Id2-HPCs
(A) In vitro differentiation of Id2-HPCs into myeloid cells. Cells were cultured in IL-3, Flt3L, GMCSF and MCSF in the presence or absence of doxycycline for 2 days in vitro and analyzed by FACS at day 0 and day 2 for CD11b. (B) In vitro differentiation of Id2-HPCs to pro-B cells. Cells were cultured in IL-7, SCF in the presence or absence of doxycycline for 6 days in vitro and analyzed at day 0, day 2, day 4 and day 5 for GFP, CD19, and Ly6D expression. (C) IgH gene rearrangement in differentiated Id2-HPCs. DNA was isolated from wild type bone marrow, day 0 Id2-HPCs and day 8 plus doxycycline Id2-HPCs and analyzed by Southern blotting for IgH DJ and V-DJ rearrangements. ATM was used as a loading control. (D) Gene expression analysis of lineage specific transcripts in undifferentiated Id2-HPCs, and CD19+ or CD11b+ differentiated Id2-HPCs. RNA was isolated from monoclonal Id2-HPCs at the undifferentiated state or the CD19+ or CD11b+ differentiated state, and transcript levels were analyzed by real-time PCR analysis.
Figure 4
Figure 4. Establishment of Promoter and Enhancer Marks in Differentiating B and Myeloid Cells
(A) Multipotent progenitors carrying Id2 were differentiated into either CD19+ B cells (upon exposure to doxycycline) or CD11b+ myeloid cells. Gene expression patterns of multipotent progenitors and differentiated progeny were analyzed by microarray. (B) Changes in gene expression levels correlate to changes in proximal H3K4me3 mapped reads between HPCs, B and myeloid cells. Changes in H3K4me3 were directly compared to gene expression levels. Expression from genes with two-fold more mapped reads (tags) in one lineage versus another lineage are indicated in green (B > 0h or M > 0h) or blue (0h > B or 0h > M), and peaks with less than a two-fold change in mapped reads (tags) are shown in grey (N.C. refers to No Change). 0h refers multipotent Id2-HPC cells. M refers to myeloid cells as characterized by CD11b expression that were differentiated from Id2-HPCs. B refers to B cells as characterized by CD19 expression that were differentiated from Id2-HPCs. P-values are indicated. N.S. refers to not significant. (C) Changes in gene expression levels correlate to changes in distal H3K4me1 mapped reads between HPCs, B cells and myeloid cells.
Figure 5
Figure 5. The Enhancer Repertoires of Multipotent Progenitors are Primed for Activation
Multipotent progenitors (Id2-HPC) and differentiated progeny (B and M) were analyzed for active enhancer repertoires. Distributions of H3K4me1 in multipotent progenitors as well as differentiated progeny are shown across Foxo1 (chr3: 52,356,303-52,540,000), Ebf1 (chr11: 44,460,539-44,849,952), Vpreb3 (chr10: 75,390,000–75,394,700), Cebpa (chr7: 34,825,439-34,833,310), Csf1r (chr18: 61,229,941-61,257,506), and Thy1 (chr9: 43,793,835-43,800,231) genomic regions. Patterns were normalized against ten million tags. The transcript on top of each graph is shown as in the UCSC Browser. Numbers indicate the number of normalized mapped reads (tags) observed. Black bars on top of transcripts indicate regions cloned for luciferase studies.
Figure 6
Figure 6. Establishment of Lineage-Specific Enhancer Repertoires
(A) Analysis of changes in H3K4me1 mapped reads (tags) between hematopoietic multipotent progenitors (Id2-HPCs) and CD19+ B cells. B cells were derived from Id2-HPCs upon in vitro differentiation. Scatter plot displays the number of H3K4me1 mapped reads across H3K4me1 marked regions in Id2-HPCs versus CD19+ B cells. Distributions of H3K4me1 mapped reads showing a two-fold or greater increase in mapped reads in Id2-HPCs versus differentiated CD19+ B-cells are shown in blue, and peaks with a two-fold or greater increase in mapped reads in CD19+ B cells are indicated in green. Numbers reflect P-values. Cis-regulatory elements associated with H3K4me1 regions were identified by computational analysis (HOMER). (B) Analysis of changes in H3K4me1 mapped reads (tags) between hematopoietic multipotent progenitors (Id2-HPC) and myeloid cells. Myeloid cells were derived from Id2-HPCs upon in vitro differentiation. Scatter plot displays the number of H3K4me1 mapped reads across H3K4me1 marked regions in Id2-HPCs versus CD11b+ myeloid cells. Distributions of H3K4me1 mapped reads showing a two-fold or greater increase in mapped reads in Id2-HPCs versus differentiated CD11b+ myeloid cells are shown in blue, and peaks with a two-fold or greater increase in mapped reads in CD11b+ myeloid cells are indicated in green. Numbers reflect P-values. Cis-regulatory elements associated with H3K4me1 regions were identified by computational analysis (HOMER). (C) Analysis of changes in H3K4me1 mapped reads (tags) between myeloid and CD19+ B cells. Myeloid and B cells were derived from Id2-HPCs upon in vitro differentiation. Scatter plot displays the number of H3K4me1 mapped reads across H3K4me1 marked regions in CD11b+ myeloid versus CD19+ B cells. Distributions of H3K4me1 mapped reads showing a two-fold or greater increase in mapped reads in CD11b+ myeloid cells versus differentiated CD19+ B-cells are shown in blue, and peaks with a two-fold or greater increase in mapped reads in CD19+ B cells are indicated in green. Numbers reflect P-values. Cis-regulatory elements associated with H3K4me1 regions were identified by computational analysis (HOMER).
Figure 7
Figure 7. Evolving Enhancer Repertoires in Developing Multipotent Progenitors
(A) Multipotent progenitors (Id2-HPCs) were differentiated into pro-B cells over a 5-day timecourse, and RNA was taking at 7 timepoints for microarray analysis. Expression was normalized to day 0. Cluster I refers to genes activated 120 hours post differentiation. Cluster II refers to genes activated 48 hours post differentiation. Cluster III refers to genes repressed 120 hours post differentiation. (B) Enriched regulatory motifs at distal H3K4me1 sites during early B cell differentiation. ChIP-Seq was performed on multipotent progenitors (Id2-HPC) at 0-, 48-, and 120-hours after induction of B cell differentiation. De novo motif finding was performed to determine transcription factor binding motifs associated with active enhancers of genes that are upregulated (CI), intermediately upregulated (C2), and downregulated (C3). The known motif names are indicated to the left of the de novo motifs. Log P-values of the de novo motifs are indicated below of the names of the motifs. “-”refers to unknown motif.

References

    1. Adolfsson J, Månsson R, Buza-Vidas N, Hultquist A, Liuba K, Jensen CT, Bryder D, Yang L, Borge OJ, Thoren LAM, et al. Identification of Flt3+ Lympho-Myeloid Stem Cells Lacking Erythro-Megakaryocytic Potential: A Revised Road Map for Adult Blood Lineage Commitment. Cell. 2005;121:295–306. - PubMed
    1. Agata Y, Tamaki N, Sakamoto S, Ikawa T, Masuda K, Kawamoto H, Murre C. Regulation of T Cell Receptor [beta] Gene Rearrangements and Allelic Exclusion by the Helix-Loop-Helix Protein, E47. Immunity. 2007;27:871–884. - PubMed
    1. Bain G, Engel I, Robanus Maandag E, te Riele H, Voland J, Sharp L, Chun J, Huey B, Pinkel D, Murre C. E2A deficiency leads to abnormalities in alphabeta T-cell development and to rapid development of T-cell lymphomas. Mol Cell Biol. 1997;17:4782–4791. - PMC - PubMed
    1. Bain G, Maandag ECR, Izon DJ, Amsen D, Kruisbeek AM, Weintraub BC, Krop I, Schlissel MS, Feeney AJ, van Roon M, et al. E2A proteins are required for proper B cell development and initiation of immunoglobulin gene rearrangements. Cell. 1994;79:885–892. - PubMed
    1. Barski A, Cuddapah S, Cui K, Roh TY, Schones DE, Wang Z, Wei G, Chepelev I, Zhao K. High-Resolution Profiling of Histone Methylations in the Human Genome. Cell. 2007;129:823–837. - PubMed

Publication types

Substances