. 2011 Oct 28;286(43):37196-206.
doi: 10.1074/jbc.M111.258129. Epub 2011 Sep 7.

5-aza-2'-deoxycytidine activates iron uptake and heme biosynthesis by increasing c-Myc nuclear localization and binding to the E-boxes of transferrin receptor 1 (TfR1) and ferrochelatase (Fech) genes

Affiliations

5-aza-2'-deoxycytidine activates iron uptake and heme biosynthesis by increasing c-Myc nuclear localization and binding to the E-boxes of transferrin receptor 1 (TfR1) and ferrochelatase (Fech) genes

Bo Ning et al. J Biol Chem. .

Abstract

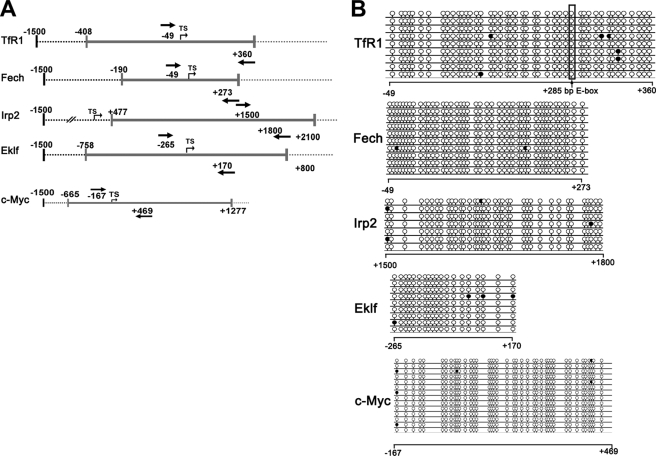
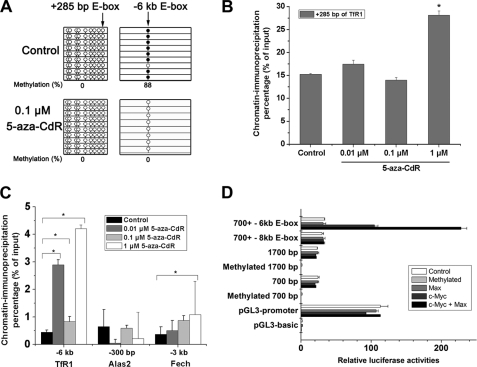
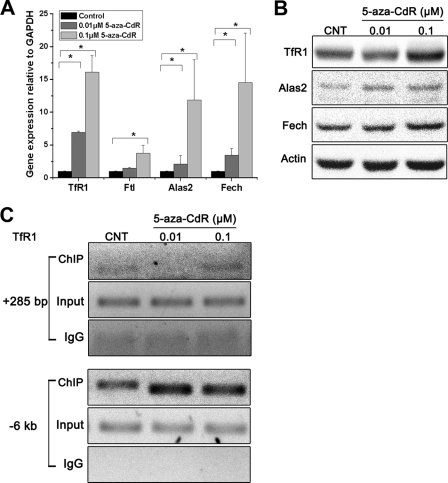
The hypomethylating agent 5-aza-2'-deoxycytidine (5-aza-CdR) and its derivatives have been successfully used for the treatment of myelodysplastic syndromes, and they frequently improve the anemia that usually accompanies these disorders. However, the molecular mechanisms underlying this action remain poorly understood. In this study, we used two erythroid models, murine erythroid leukemia cells and erythroid burst-forming unit-derived erythroblasts, to show that 5-aza-CdR induced erythroid differentiation and increased the expression of transferrin receptor 1 (TfR1) and ferrochelatase (Fech), thereby increasing iron uptake and heme biosynthesis. We have identified new regulatory E-boxes that lie outside of CpG islands in the TfR1 and Fech promoters, and the methylation status of these sites can be altered by 5-aza-CdR treatment. This in turn altered the binding of the transcription factor c-Myc to these promoter elements. Furthermore, 5-aza-CdR promoted the nuclear translocation of c-Myc and its binding to Max to form functional complexes. The coordinated actions of 5-aza-CdR on the methylation status of the target genes and in stimulating the nuclear translocation of c-Myc provide new molecular insights into the regulation of E-boxes and explain, at least in part, the increased erythroid response to 5-aza-CdR treatment.


Figures

FIGURE 1.
FIGURE 1.
5-Aza-CdR stimulated the expression of genes associated with erythroid iron acquisition and heme synthesis. MEL cells were treated with 1.8% DMSO or 5-aza-CdR (0.1 or 1 μm) for 48 h. Cells were collected for total RNA and protein isolation. A, quantitative real-time RT-PCR showed increases in the mRNA levels of TfR1, Hba1, Hbb1, Alas2, and Fech. *, p < 0.01 compared with the control MEL cells. B, a representative Western blot showing the levels of TfR1, Alas2, and Fech protein in 5-aza-CdR-treated MEL cells. C, densitometry analysis of the expression of TfR1, Alas2, and Fech protein levels (the densitometry was normalized to the levels of β-actin). *, p < 0.01 compared with the control MEL cells. D, cellular iron uptake in control and 5-aza-CdR-treated MEL cells. MEL cells treated with or without 5-aza-CdR for 48 h were incubated for 0.5, 1.5, or 3 h with 1.85 μm 55Fe-Tf. After washing three times with cold PBS, the radioactivity was measured using a scintillation counter. *, p < 0.01 compared with 1.5 h control MEL cells; **, p < 0.01 compared with 3 h control MEL cells. E, heme levels in MEL cells treated with or without 5-aza-CdR. Cellular extracts (10 μg of total protein) were analyzed by measurement of fluorescent PPIX levels after removing iron from endogenous heme. *, p < 0.01 compared with control MEL cells. Error bars, S.E.
FIGURE 2.
FIGURE 2.
Bioinformatic analysis and bisulfite sequencing of CpG islands. A, schematic illustrations of the promoter regions of the genes of interest. CpG islands were predicted and analyzed by Methyl Primer Express Software version 1.0 (Applied Biosystems). The TSS of each gene is shown with an arrow, and gray lines indicate CpG islands. The positions of sequencing primers are shown with boldface arrows (numbers start from the TSS). B, genomic DNA of MEL cells was bisulfite-converted, PCR-amplified, and cloned. Single clones were sequenced. The sequencing results for each clone are shown, with lollipops representing cytosines. Methylated cytosines are shown as black lollipops, and unmethylated cytosines are shown as open lollipops.
FIGURE 3.
FIGURE 3.
5-Aza-CdR treatment led to c-Myc accumulation and increased binding to Max in nuclei. A, mRNA levels of c-Myc, Gata1, and Eklf were analyzed by quantitative real-time RT-PCR as described in Fig. 1A. B, analysis of the levels of the transcription factor c-Myc in MEL cells treated with or without 5-aza-CdR. MEL cells were collected and separated into two populations for the isolation of nuclei and total protein. c-Myc was detected in both the nuclear and total protein fractions. For co-immunoprecipitation of c-Myc-Max complexes, nuclear fractions were precipitated with anti-Max antibodies and c-Myc levels were detected in the precipitates by Western blotting with anti-c-Myc antibodies. β-Actin and IgG were included as controls. C, densitometry analysis of the levels of c-Myc (normalized to untreated cells). *, p < 0.01 compared with the control MEL cells. Error bars, S.E.
FIGURE 4.
FIGURE 4.
5-Aza-CdR treatment led to E-box demethylation and occupation by c-Myc in the promoters of the TfR1, Alas2, and Fech genes. A, bisulfite sequencing of the methylation status of the E-boxes in TfR1 promoters (+285 bp and −6 kb E-boxes) before and after 5-aza-CdR treatment. B, ChIP assay of the E-box in the CpG island of the TfR1 promoter (+285 bp). *, p < 0.01 compared with the control MEL cells. C, ChIP assay of E-boxes outside the CpG islands of the TfR1, Alas2, and Fech genes. *, p < 0.01 compared with the control MEL cells. A specific antibody to c-Myc was used for the ChIP assays of the TfR1, Fech, and Alas2 promoters, followed by sequence-specific PCR analysis of specific binding sites of c-Myc. D, transcriptional activities of the constructs containing different E-boxes of TfR1 promoters (+285, −6 kb, or −8 kb E-boxes). Luciferase activities of the constructs containing different fragments of TfR1 promoter, including a 700-bp fragment (−183 to +550), 1700-bp fragment (−1230 to +550), 700-bp fragment plus −6 kb E-box (−6267 to −6061), and 700-bp fragment plus −8 kb E-box (−8689 to −8421) were measured under co-transfection with the expression vectors of c-Myc, Max, or both. All of these E-boxes in these promoter fragments were in demethylated status. Luciferase activities of the constructs containing methylated 700- and 1700-bp fragments were also measured. Firefly luciferase activities were normalized by Renilla luciferase. Error bars, S.E.
FIGURE 5.
FIGURE 5.
5-Aza-CdR stimulated the expression of specific genes associated with iron uptake and heme synthesis in mouse BFU-Es. Murine bone marrow cells were cultured in MethoCult semisolid medium with different concentrations of 5-aza-CdR for 24 h. The cells were cultured for a further 8 days in the absence of 5-aza-CdR. BFU-Es were collected for quantitative real-time RT-PCR (A), Western blotting analysis (B), and status of c-Myc binding to the TfR1 promoter (C) as described in the legends to Figs. 1 (A and B) and 4B, respectively. Error bars, S.E.

References

    1. Nimer S. D. (2008) Blood 111, 4841–4851 - PubMed
    1. Tefferi A., Vardiman J. W. (2009) N. Engl. J. Med. 361, 1872–1885 - PubMed
    1. Aul C., Bowen D. T., Yoshida Y. (1998) Haematologica 83, 71–86 - PubMed
    1. Hofmann W. K., Koeffler H. P. (2005) Annu. Rev. Med. 56, 1–16 - PubMed
    1. Jädersten M., Hellström-Lindberg E. (2010) Exp. Cell Res. 316, 1390–1396 - PubMed

Publication types

MeSH terms