. 2012 Jan;29(1):145-56.
doi: 10.1093/molbev/msr172. Epub 2011 Sep 8.

An autosomal analysis gives no genetic evidence for complex speciation of humans and chimpanzees

Affiliations

An autosomal analysis gives no genetic evidence for complex speciation of humans and chimpanzees

Masato Yamamichi et al. Mol Biol Evol. 2012 Jan.

Abstract

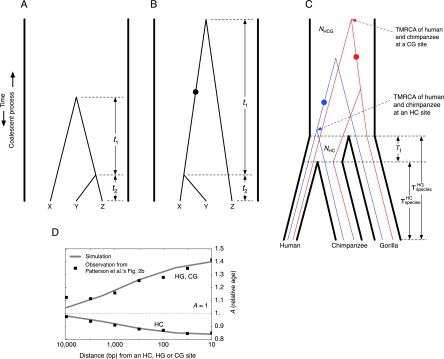
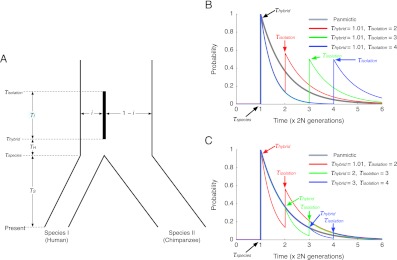
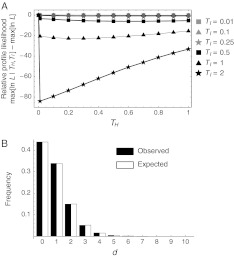
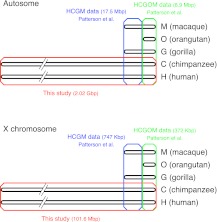
There have been conflicting arguments as to what happened in the human-chimpanzee speciation event. Patterson et al. (2006, Genetic evidence for complex speciation of humans and chimpanzees. Nature 441:1103-1108) proposed a hypothesis that the human-chimpanzee speciation event involved a complicated demographic process: that is, the ancestral lineages of humans and chimpanzees experienced temporal isolation followed by a hybridization event. This hypothesis stemmed from two major observations: a wide range of human-chimpanzee nucleotide divergence across the autosomal genome and very low divergence in the X chromosome. In contrast, Innan and Watanabe (2006, The effect of gene flow on the coalescent time in the human-chimpanzee ancestral population. Mol Biol Evol. 23:1040-1047) demonstrated that the null model of instantaneous speciation fits the genome-wide divergence data for the two species better than alternative models involving partial isolation and migration. To reconcile these two conflicting reports, we first reexamined the analysis of autosomal data by Patterson et al. (2006). By providing a theoretical framework for their analysis, we demonstrated that their observation is what is theoretically expected under the null model of instantaneous speciation with a large ancestral population. Our analysis indicated that the observed wide range of autosomal divergence is simply due to the coalescent process in the large ancestral population of the two species. To further verify this, we developed a maximum likelihood function to detect evidence of hybridization in genome-wide divergence data. Again, the null model with no hybridization best fits the data. We conclude that the simplest speciation model with instantaneous split adequately describes the human-chimpanzee speciation event, and there is no strong reason to involve complicated factors in explaining the autosomal data.


Figures

F<sc>ig</sc> 1.
Fig 1.
(A) Standard coalescent process with three haploid individuals, X, Y and Z. (B) Coalescent process at a biallelic site. The black circle represents the mutation that created two alleles. (C) Simple allopatric speciation model for human, chimpanzee, and gorilla. Typical genealogical trees at HC and CG sites are also illustrated with blue and red lines. (D) The effect of recombination on the relative age, A. The gray lines show the simulation results in the null model of instantaneous speciation. The observation of Patterson et al. (2006) is shown by filled squares (data from figure 2 in Patterson et al. 2006).
F<sc>ig</sc> 2.
Fig 2.
(A) Model of isolation and hybridization used in this study. (BC) Distributions of coalescent time predicted under this model (computed by eq. (4)) with various parameters.
F<sc>ig</sc> 3.
Fig 3.
(A) ML analysis of the autosomal data, 𝒟A, computed by equation (6). The log-likelihood value is scaled so that the maximum log likelihood over all investigated parameter ranges is 0. (B) The observed distribution of d (i.e., 𝒟A), compared with its expectation under the null model with the best-fit parameter.
F<sc>ig</sc> 4.
Fig 4.
The power of the ML approach and its robustness to recombination and mutation rate variation, which are evaluated by the proportion of simulation runs with Δ > 2.17. The arrow represents the parameter pair that is roughly in agreement with estimates for the human genome. See text for details.
F<sc>ig</sc> 5.
Fig 5.
Illustration of the data used in this study and Patterson et al. (2006).

Similar articles

Cited by

References

    1. Barton NH. Evolutionary biology: how did the human species form? Curr Biol. 2006;16:R647–R650. - PubMed
    1. Becquet C, Patterson N, Stone AC, Przeworski M, Reich D. Genetic structure of chimpanzee populations. PLoS Genet. 2007;3:e66. - PMC - PubMed
    1. Benson G. Tandem repeats finder: a program to analyze DNA sequences. Nucleic Acids Res. 1999;27:573–580. - PMC - PubMed
    1. Betancourt AJ, Kim Y, Orr HA. A pseudohitchhiking model of X vs. autosomal diversity. Genetics. 2004;168:2261–2269. - PMC - PubMed
    1. Bouffard GG, Idol JR, Braden VV, et al. (14 co-authors) A physical map of human chromosome 7: an integrated YAC contig map with average STS spacing of 79 kb. Genome Res. 1997;7:673–692. - PubMed

Publication types