

Changes in severity of 2009 pandemic A/H1N1 influenza in England: a Bayesian evidence synthesis
- PMID: 21903689
- PMCID: PMC3168935
- DOI: 10.1136/bmj.d5408
Changes in severity of 2009 pandemic A/H1N1 influenza in England: a Bayesian evidence synthesis
Abstract
Objective: To assess the impact of the 2009 A/H1N1 influenza pandemic in England during the two waves of activity up to end of February 2010 by estimating the probabilities of cases leading to severe events and the proportion of the population infected.
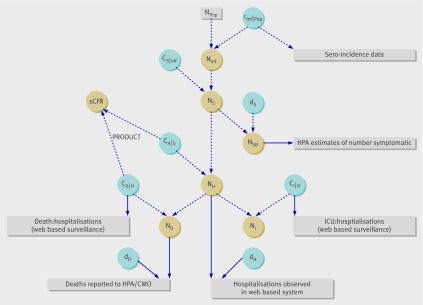
Design: A Bayesian evidence synthesis of all available relevant surveillance data in England to estimate severity of the pandemic.
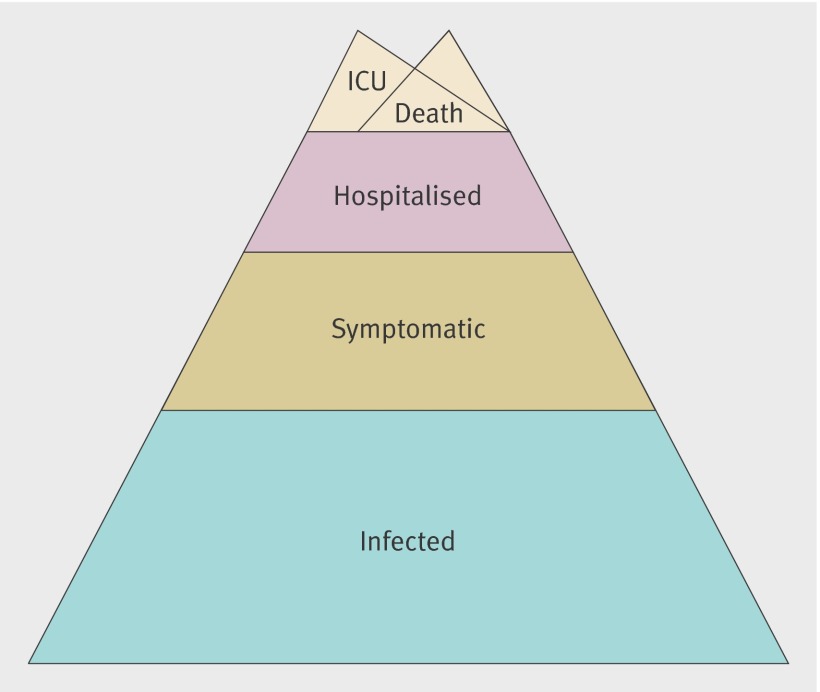
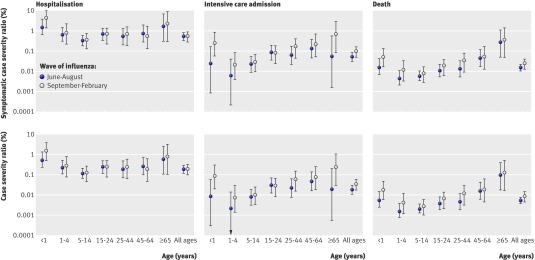
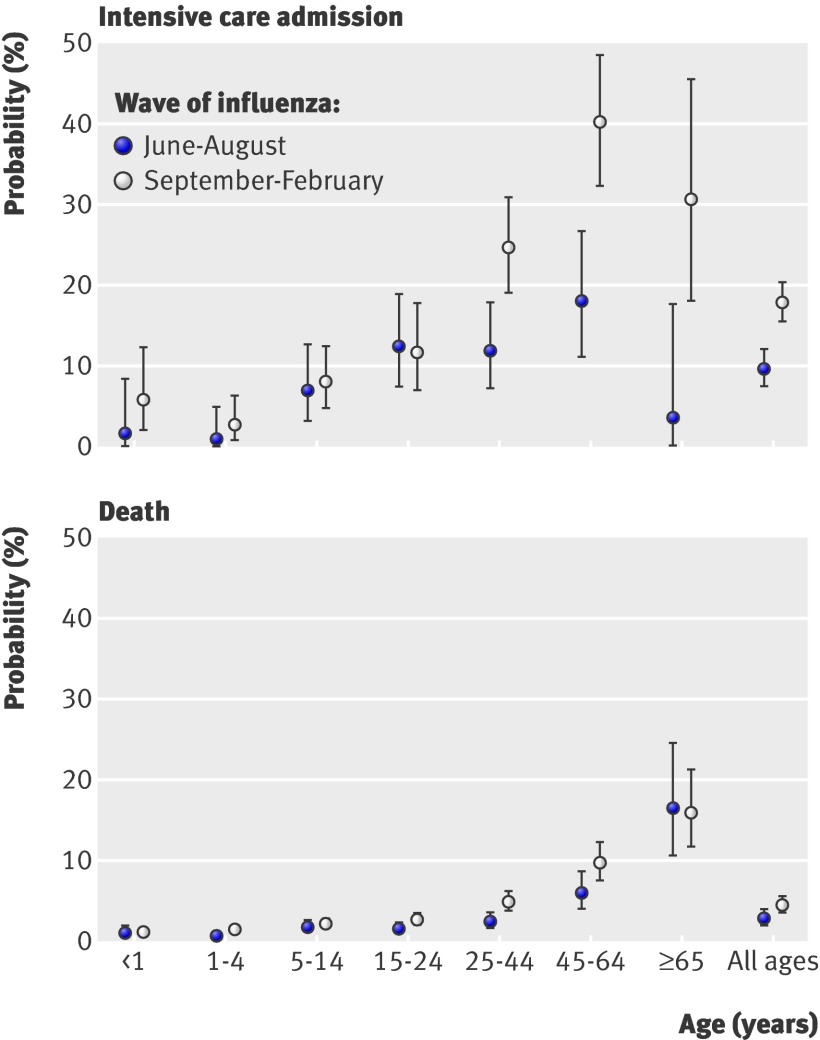
Data sources: All available surveillance systems relevant to the pandemic 2009 A/H1N1 influenza outbreak in England from June 2009 to February 2010. Pre-existing influenza surveillance systems, including estimated numbers of symptomatic cases based on consultations to the health service for influenza-like illness and cross sectional population serological surveys, as well as systems set up in response to the pandemic, including follow-up of laboratory confirmed cases up to end of June 2009 (FF100 and Fluzone databases), retrospective and prospective follow-up of confirmed hospitalised cases, and reported deaths associated with pandemic 2009 A/H1N1 influenza. Main outcome measures Age specific and wave specific probabilities of infection and symptomatic infection resulting in hospitalisation, intensive care admission, and death, as well as infection attack rates (both symptomatic and total). The probabilities of intensive care admission and death given hospitalisation over time are also estimated to evaluate potential changes in severity across waves.
Results: In the summer wave of A/H1N1 influenza, 0.54% (95% credible interval 0.33% to 0.82%) of the estimated 606,100 (419,300 to 886,300) symptomatic cases were hospitalised, 0.05% (0.03% to 0.08%) entered intensive care, and 0.015% (0.010% to 0.022%) died. These correspond to 3200 (2300 to 4700) hospital admissions, 310 (200 to 480) intensive care admissions, and 90 (80 to 110) deaths in the summer wave. In the second wave, 0.55% (0.28% to 0.89%) of the 1,352,000 (829,900 to 2,806,000) estimated symptomatic cases were hospitalised, 0.10% (0.05% to 0.16%) were admitted to intensive care, and 0.025% (0.013% to 0.040%) died. These correspond to 7500 (5900 to 9700) hospitalisations, 1340 (1030 to 1790) admissions to intensive care, and 240 (310 to 380) deaths. Just over a third (35% (26% to 45%)) of infections were estimated to be symptomatic. The estimated probabilities of infections resulting in severe events were therefore 0.19% (0.12% to 0.29%), 0.02% (0.01% to 0.03%), and 0.005% (0.004% to 0.008%) in the summer wave for hospitalisation, intensive care admission, and death respectively. The corresponding second wave probabilities are 0.19% (0.10% to 0.32%), 0.03% (0.02% to 0.06%), and 0.009% (0.004% to 0.014%). An estimated 30% (20% to 43%) of hospitalisations were detected in surveillance systems in the summer, compared with 20% (15% to 25%) in the second wave. Across the two waves, a mid-estimate of 11.2% (7.4% to 18.9%) of the population of England were infected, rising to 29.5% (16.9% to 64.1%) in 5-14 year olds. Sensitivity analyses to the evidence included suggest this infection attack rate could be as low as 5.9% (4.2% to 8.7%) or as high as 28.4% (26.0% to 30.8%). In terms of the probability that an infection leads to death in the second wave, these correspond, respectively, to a high estimate of 0.017% (0.011% to 0.024%) and a low estimate of 0.0027% (0.0024% to 0.0031%).
Conclusions: This study suggests a mild pandemic, characterised by case and infection severity ratios increasing between waves. Results suggest low ascertainment rates, highlighting the importance of systems enabling early robust estimation of severity, to inform optimal public health responses, particularly in light of the apparent resurgence of the 2009 A/H1N1 strain in the 2010-11 influenza season.
Conflict of interest statement
Competing interests: All authors have completed the Unified Competing Interest form at
Figures
References
-
- World Health Organization. Pandemic (H1N1) 2009—update 112. 2010. www.who.int/csr/don/2010_08_06/en/index.html.
-
- Garske T, Legrand J, Donnelly C, Ward H, Cauchemez S, Fraser C, et al. Assessing the severity of the novel influenza A/H1N1 pandemic. BMJ 2009;339:b2840. - PubMed
Publication types
MeSH terms
Grants and funding
LinkOut - more resources
Full Text Sources
Other Literature Sources
Medical