. 2011 Oct;134(Pt 10):2948-59.
doi: 10.1093/brain/awr212. Epub 2011 Sep 8.

Data mining neocortical high-frequency oscillations in epilepsy and controls

Affiliations

Data mining neocortical high-frequency oscillations in epilepsy and controls

Justin A Blanco et al. Brain. 2011 Oct.

Abstract

Transient high-frequency (100-500 Hz) oscillations of the local field potential have been studied extensively in human mesial temporal lobe. Previous studies report that both ripple (100-250 Hz) and fast ripple (250-500 Hz) oscillations are increased in the seizure-onset zone of patients with mesial temporal lobe epilepsy. Comparatively little is known, however, about their spatial distribution with respect to seizure-onset zone in neocortical epilepsy, or their prevalence in normal brain. We present a quantitative analysis of high-frequency oscillations and their rates of occurrence in a group of nine patients with neocortical epilepsy and two control patients with no history of seizures. Oscillations were automatically detected and classified using an unsupervised approach in a data set of unprecedented volume in epilepsy research, over 12 terabytes of continuous long-term micro- and macro-electrode intracranial recordings, without human preprocessing, enabling selection-bias-free estimates of oscillation rates. There are three main results: (i) a cluster of ripple frequency oscillations with median spectral centroid = 137 Hz is increased in the seizure-onset zone more frequently than a cluster of fast ripple frequency oscillations (median spectral centroid = 305 Hz); (ii) we found no difference in the rates of high frequency oscillations in control neocortex and the non-seizure-onset zone neocortex of patients with epilepsy, despite the possibility of different underlying mechanisms of generation; and (iii) while previous studies have demonstrated that oscillations recorded by parenchyma-penetrating micro-electrodes have higher peak 100-500 Hz frequencies than penetrating macro-electrodes, this was not found for the epipial electrodes used here to record from the neocortical surface. We conclude that the relative rate of ripple frequency oscillations is a potential biomarker for epileptic neocortex, but that larger prospective studies correlating high-frequency oscillations rates with seizure-onset zone, resected tissue and surgical outcome are required to determine the true predictive value.


Figures

Figure 1
Figure 1
Cluster member examples. Five randomly selected waveforms from each of the four clusters found using the automated detection and unsupervised classification method of Blanco et al. (2010). Waveforms are 100–500 Hz bandpass filtered segments corresponding to detections (truncated to 25 ms, if necessary, to put all waveforms on the same time scale for comparison).
Figure 2
Figure 2
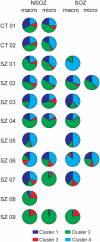
Subject-channel events by cluster. The area of each pie chart wedge corresponds to the mean proportion of events in a given cluster. Blue = Cluster 1 (‘mixed frequency’); green = Cluster 2 (putative artefact); red = Cluster 3 (‘fast ripple’); and cyan = Cluster 4 (‘ripple’), where the mean is over all channels in the category defined by the row and column of the pie. Empty cells in the table indicate that no data were available. CT01 and CT02 are the control patients; SZ01–SZ09 are the subjects with epilepsy. Macro = macro-electrode; micro = micro-electrode; NSOZ = non-seizure-onset zone; SOZ = seizure-onset zone.
Figure 3
Figure 3
Non-seizure-onset zone versus seizure-onset zone. Macro-electrode data for subject SZ01 (A), SZ05 (B), SZ06 (C) and SZ07 (D). On the left side in each panel, there are two box-and-whisker plots for each of the four detected high-frequency oscillation clusters, one corresponding to non-seizure-onset zone channels (left) and one to seizure-onset zone channels. On each box, the central mark is the median event rate (counts/s) and the edges are the 25th and 75th percentiles. Whiskers extend to the most extreme data points not considered outliers, defined as points >1.5 times the interquartile range above the 75th percentile or below the 25th percentile and plotted individually as red crosses. Dotted line in top left panel represents an arbitrary value to which a single large outlier (34.7 × 10−3) was clipped for visualization purposes. Notch widths are computed according to McGill et al. (1978); lack of notch overlap is a rough test for significant differences in medians at the 5% significance level; we use the Mann–Whitney U-test on the distributions to more formally test significance. On the right side in each panel, Cluster 4 event rates are shown for the individual channels of all electrodes containing seizure-onset zone contacts. Where channel numbers are not continuous, data were not available. Bars corresponding to seizure-onset zone channels are coloured in red, and the spatial arrangement of channels is given in the inset maps, in which seizure-onset zone channels are also coloured red. The map for (A) was superimposed on a brain image using the method of Wellmer et al. (2002). Channels located beneath the dura are not depicted, but their locations are readily inferred. Space constraints prohibited including comparable images for the other subjects; these can be found in Supplementary Fig. 1. NSOZ = non-seizure-onset zone; SOZ = seizure-onset zone. Asterisks indicate Bonferroni corrected P-value for Mann–Whitney U-test < 0.1; M = marginally significant at α level 0.1, but does not survive the Bonferroni correction.
Figure 4
Figure 4
Event peak frequency. Histogram density estimates for the peak 100–500 Hz frequency of events (Clusters 1–4, aggregated) on micro- (white) and macro- (hatched) electrodes, for surface (A) and depth (B) electrodes. HFO = high-frequency oscillation.

Similar articles

Cited by

References

    1. Aubert S, Wendling F, Regis J, McGonigal A, Figarella-Branger D, Peragut J-C, et al. Local and remote epileptogenicity in focal cortical dysplasias and neurodevelopmental tumours. Brain. 2009;132:3072–86. - PubMed
    1. Bagshaw AP, Jacobs J, LeVan P, Dubeau F, Gotman J. Effect of sleep stage on interictal high-frequency oscillations recorded from depth macroelectrodes in patients with focal epilepsy. Epilepsia. 2009;50:617–28. - PMC - PubMed
    1. Bartolomei F, Chauvel P, Wendling F. Epileptogenicity of brain structures in human temporal lobe epilepsy: a quantified study from intracerebral EEG. Brain. 2008;131(Pt 7):1818–30. - PubMed
    1. Bell ML, Rao S, So ES, Trenerry M, Kazemi N, Stead SM, et al. Epilepsy surgery outcomes in temporal lobe epilepsy with a normal MRI. Epilepsia. 2009;50:2053–60. - PMC - PubMed
    1. Bien CG, Szinay M, Wagner J, Clusmann H, Becker AJ, Urbach H. Characteristics and surgical outcomes of patients with refractory magnetic resonance imaging–negative epilepsies. Arch Neurol. 2009;66:1491–9. - PubMed

Publication types