. 2011 Dec;21(12):2213-23.
doi: 10.1101/gr.124321.111. Epub 2011 Sep 8.

Differential expression in RNA-seq: a matter of depth

Affiliations

Differential expression in RNA-seq: a matter of depth

Sonia Tarazona et al. Genome Res. 2011 Dec.

Abstract

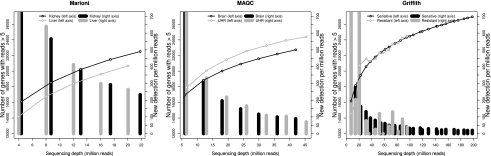
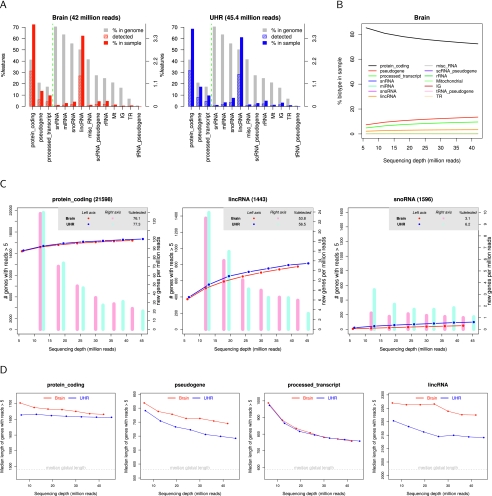
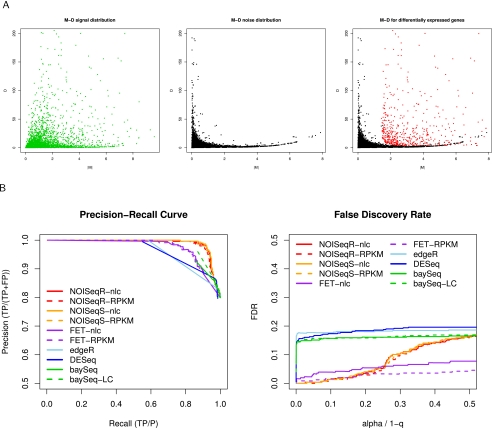
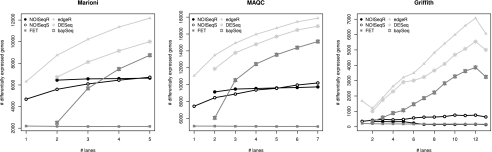
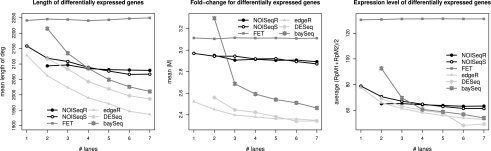
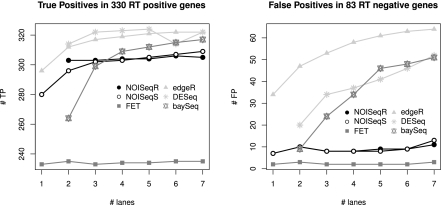
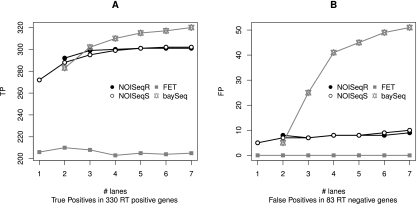
Next-generation sequencing (NGS) technologies are revolutionizing genome research, and in particular, their application to transcriptomics (RNA-seq) is increasingly being used for gene expression profiling as a replacement for microarrays. However, the properties of RNA-seq data have not been yet fully established, and additional research is needed for understanding how these data respond to differential expression analysis. In this work, we set out to gain insights into the characteristics of RNA-seq data analysis by studying an important parameter of this technology: the sequencing depth. We have analyzed how sequencing depth affects the detection of transcripts and their identification as differentially expressed, looking at aspects such as transcript biotype, length, expression level, and fold-change. We have evaluated different algorithms available for the analysis of RNA-seq and proposed a novel approach--NOISeq--that differs from existing methods in that it is data-adaptive and nonparametric. Our results reveal that most existing methodologies suffer from a strong dependency on sequencing depth for their differential expression calls and that this results in a considerable number of false positives that increases as the number of reads grows. In contrast, our proposed method models the noise distribution from the actual data, can therefore better adapt to the size of the data set, and is more effective in controlling the rate of false discoveries. This work discusses the true potential of RNA-seq for studying regulation at low expression ranges, the noise within RNA-seq data, and the issue of replication.


Figures

Figure 1.
Figure 1.
Saturation curves display the number of genes detected by more than five uniquely mapped reads as a function of the sequencing depth for each experimental condition in the three data sets (left y-axis). Vertical bars represent the number of newly detected genes per million additional reads (NDR, right y-axis) for each experimental condition.
Figure 2.
Figure 2.
Feature detection and sequencing depth for the MAQC data. (A) Detection percentages per transcript biotype. Gray bar indicates genome percentage; striped color bar is the percentage detected by the sample with regard to the genome; and solid color bar is the percentage the biotype represents in the total detected features in the sample. Vertical line separates bars expressed in left and right y-axis scales. (B) Percentage of each transcript biotype within total detections at increasing sequencing depth (brain sample). (C) Saturation curves and NDR bars for protein-coding, lincRNA, and snoRNA. (D) Median transcript length as a function of sequencing depth for protein-coding, pseudogene, processed transcript, and lincRNA biotypes. The median global length of each biotype is computed considering genes with median transcript length >150 nucleotides.
Figure 3.
Figure 3.
NOISeq method: description and performance. (A) Schematic representation of the NOISeq methodology. M-D distribution in noise (black), signal (green), and differentially expressed genes (red). Both axis scales have been trimmed to improve visualization. (B) Precision-recall curves and false-discovery rates for the differential expression methods compared on MAQC data set using RT-PCR results as a gold-standard.
Figure 4.
Figure 4.
Differentially expressed genes according to sequencing depth for each data set and method. No gene length correction was applied to the data.
Figure 5.
Figure 5.
Relationship between gene length, fold-change M, expression level of differentially expressed genes, and the number of lanes used, for each method in MAQC data set. No length correction was applied to the data. RpMi is the number of reads in condition i per million reads, namely, formula image.
Figure 6.
Figure 6.
Relationship between the number of true positives (TP) and false positives (FP) and sequencing depth. TP and FP were obtained applying different statistical methods on the MAQC data set and comparing the results to RT-PCR positive and negative genes.
Figure 7.
Figure 7.
Differential expression in the MAQC data set according to sequencing depth for methods with gene length correction using RT-PCR data as a gold standard. (A) True positives. (B) False positives.

Similar articles

Cited by

References

    1. Anders S 2010. Htseq: analysing high-throughput sequencing data with python. http://www-huber.embl.de/users/anders/HTSeq/ - PMC - PubMed
    1. Anders S, Huber W 2010. Differential expression analysis for sequence count data. Genome Biol 11: R106 doi: 10.1186/gb-2010-11-10-r106 - PMC - PubMed
    1. Anderson J 2005. RNA turnover: unexpected consequences of being tailed. Curr Biol 15: R635–R638 - PubMed
    1. Argout X, Salse J, Aury J, Guiltinan M, Droc G, Gouzy J, Allegre M, Chaparro C, Legavre T, Maximova S, et al. 2010. The genome of Theobroma cacao. Nat Genet 43: 101–108 - PubMed
    1. Blencowe BJ, Ahmad S, Lee LJ 2009. Current-generation high-throughput sequencing: deepening insights into mammalian transcriptomes. Genes Dev 23: 1379–1386 - PubMed

Publication types

MeSH terms

LinkOut - more resources