. 2011 Dec 1;17(23):7359-72.
doi: 10.1158/1078-0432.CCR-11-1388. Epub 2011 Sep 8.

Preclinical testing of PI3K/AKT/mTOR signaling inhibitors in a mouse model of ovarian endometrioid adenocarcinoma

Affiliations

Preclinical testing of PI3K/AKT/mTOR signaling inhibitors in a mouse model of ovarian endometrioid adenocarcinoma

Rong Wu et al. Clin Cancer Res. .

Abstract

Purpose: Genetically engineered mouse (GEM) models of ovarian cancer that closely recapitulate their human tumor counterparts may be invaluable tools for preclinical testing of novel therapeutics. We studied murine ovarian endometrioid adenocarcinomas (OEA) arising from conditional dysregulation of canonical WNT and PI3K/AKT/mTOR pathway signaling to investigate their response to conventional chemotherapeutic drugs and mTOR or AKT inhibitors.

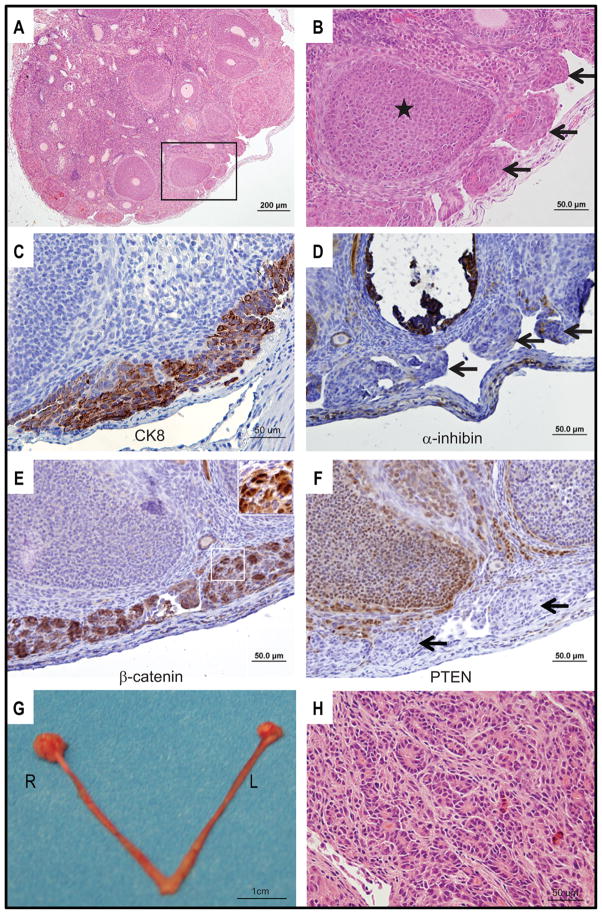
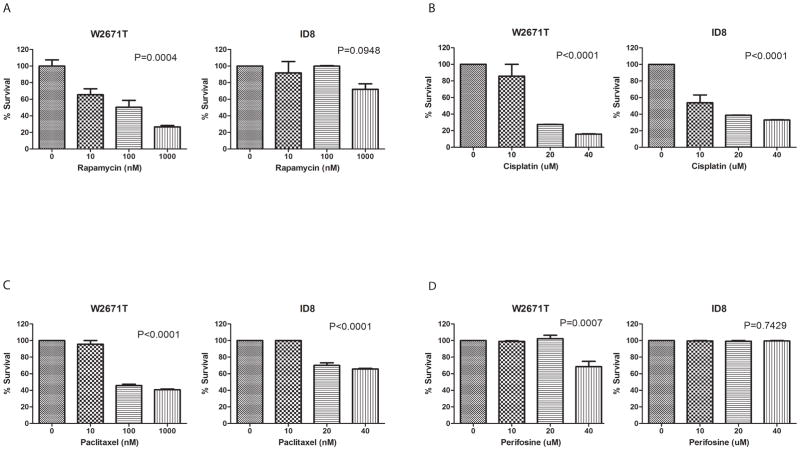
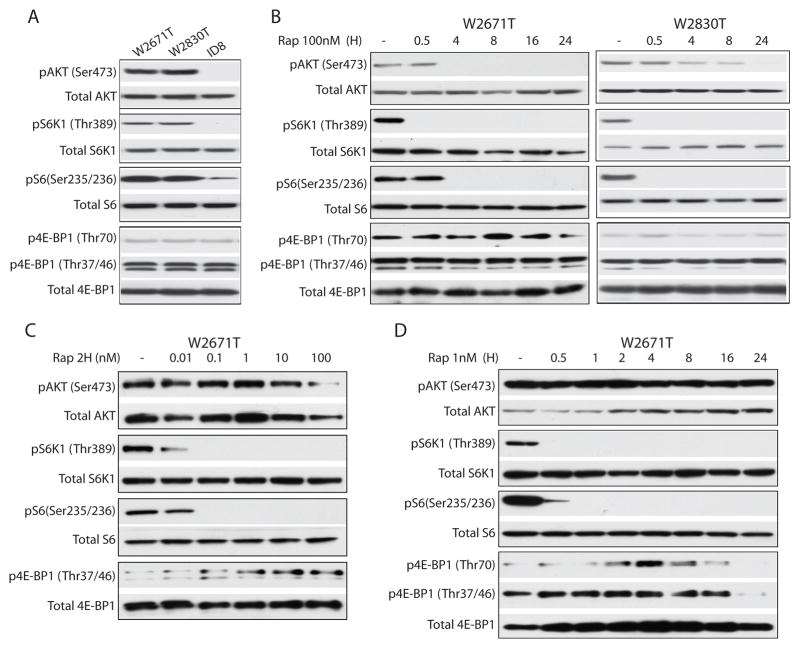
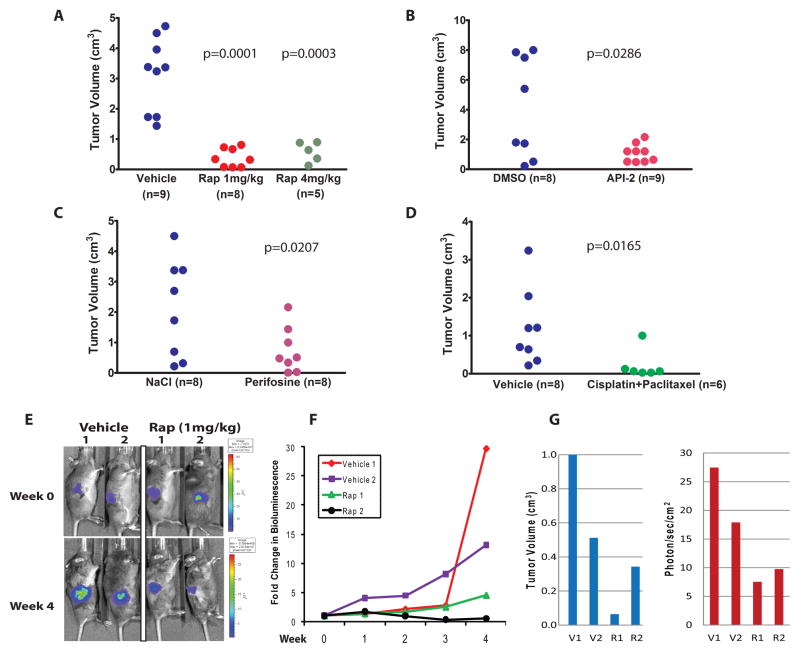
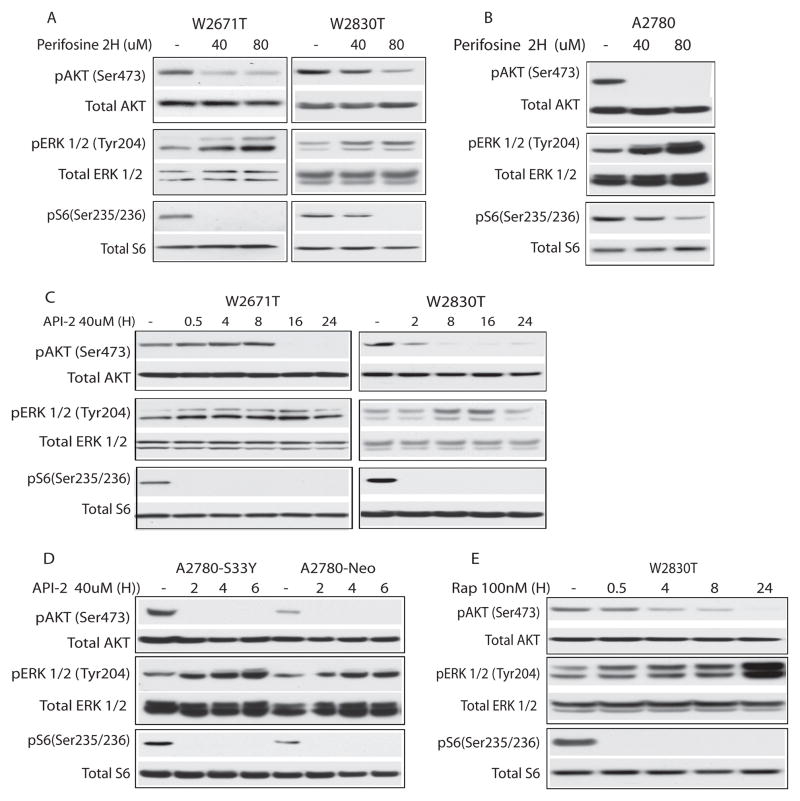
Experimental design: OEAs were induced by injection of adenovirus expressing Cre recombinase (AdCre) into the ovarian bursae of Apc(flox/flox); Pten(flox/flox) mice. Tumor-bearing mice or murine OEA-derived cell lines were treated with cisplatin and paclitaxel, mTOR inhibitor rapamycin, or AKT inhibitors API-2 or perifosine. Treatment effects were monitored in vivo by tumor volume and bioluminescence imaging, in vitro by WST-1 proliferation assays, and in OEA tissues and cells by immunoblotting and immunostaining for levels and phosphorylation status of PI3K/AKT/mTOR signaling pathway components.

Results: Murine OEAs developed within 3 weeks of AdCre injection and were not preceded by endometriosis. OEAs responded to cisplatin + paclitaxel, rapamycin, and AKT inhibitors in vivo. In vitro studies showed that response to mTOR and AKT inhibitors, but not conventional cytotoxic drugs, was dependent on the status of PI3K/AKT/mTOR signaling. AKT inhibition in APC(-)/Pten(-) tumor cells resulted in compensatory upregulation of ERK signaling.

Conclusions: The studies show the utility of this GEM model of ovarian cancer for preclinical testing of novel PI3K/AKT/mTOR signaling inhibitors and provide evidence for compensatory signaling, suggesting that multiple rather than single agent targeted therapy will be more efficacious for treating ovarian cancers with activated PI3K/AKT/mTOR signaling.


Figures

Figure 1
Figure 1. Murine OEA-like tumors arise within 3 weeks of ovarian bursal AdCre injection in Apcflox/flox;Ptenflox/flox mice
A) Low magnification photomicrograph of H&E stained section from right ovary 3 weeks after AdCre injection showing multifocal “tumorlets” on the ovarian surface. B) High magnification photomicrograph of the boxed area in panel A showing “tumorlets” (arrows) and ovarian follicle (star). Tissue sections were IHC stained for C) cytokeratin 8; D) α-inhibin; E) β-catenin; and F) PTEN. Cells in the surface tumorlets are positive for cytokeratin 8 and show strong nuclear staining for β-catenin. The tumor cells are negative for α-inhibin and PTEN (arrows indicate tumorlets). G) Gross photograph of upper genital tract 6 weeks after AdCre injection of right ovarian bursa shows modestly enlarged right (R) ovary relative to the control left (L) ovary. H) Photomicrograph of H&E stained section from ovarian tumor present 6 weeks after AdCre injection. Areas of overt glandular differentiation are admixed with poorly differentiated and spindle cell areas.
Figure 2
Figure 2. Endometriosis-like lesions are present in the ovaries of Apcflox/flox mice
Photomicrographs of H&E stained sections from the A) right and B) left ovaries of Apcflox/flox mice 12 months after AdCre injection showing endometriosis-like lesions with endometrial-type glands (yellow stars) and adjacent stroma (white stars). Tissue sections with endometriosis were IHC stained for C) cytokeratin 8, D) CD10, E) α-inhibin, and F) β-catenin. The glandular epithelium (yellow stars) is strongly positive for cytokeratin 8, negative for α-inhibin, and shows membranous staining for β-catenin. The adjacent stroma shows focal CD10 positivity (black arrow) and is only weakly positive forα-inhibin compared to granulosa cells in the ovarian follicle (black star).
Figure 3
Figure 3. Status of PI3K/AKT/mTOR signaling in murine ovarian cancer cells determines response to Akt and mTOR inhibitors, but not to conventional cytotoxic drugs
Growth inhibitory effects of A) rapamycin, B) cisplatin, C) paclitaxel, and D) perifosine were evaluated in W2671T, W2830T and ID8 cells in vitro. After exposure to indicated drugs or controls for 24 hr, cell viability was measured with WST-1 reagent. Proportional viability (%) was calculated by comparing the drugs with vehicle controls, whose viability was assumed to be 100%. Values represent the average of three independent assays performed in duplicate, expressed as means ± SD. Differences between control and treated cells were analyzed by one way ANOVA.
Figure 4
Figure 4. Characterization of PI3K/AKT/mTOR signaling pathway regulation in murine ovarian cancer cells after treatment with mTOR or Akt inhibitors
Immunoblots showing A) Endogenous levels of phosphorylated and total Akt, S6K1, S6, and 4E-BP1 in W2671T, W2830T and ID8 cells. B) Time course of high dose (100nM) rapamycin treatment of W2671T and W2830T cell lines. Phosphorylated and total Akt, S6K1, S6, and 4E-BP1 are shown. C) Dose-dependent effect of rapamycin (0.01nM to 100nM) on phosphorylation of Akt, S6K1, S6, and 4E-BP1 after exposure to rapamycin for 2 hr in W2671T. D) Time course of low dose (1nM) rapamycin treatment of W2671T cells. Phosphorylated and total Akt, S6K1, S6, and 4E-BP1 are shown.
Figure 5
Figure 5. Inhibition of APC/PTEN murine ovarian tumor growth in vivo by conventional chemotherapy and drugs targeting activated PI3K/Akt/mTOR signaling
Small ovarian tumors present 6 weeks after AdCre injection were treated for 4 weeks with vehicle or A) rapamycin (1mg/kg and 4mg/kg), B) API-2, C) perifosine, or D) cisplatin plus paclitaxel. Mice were euthanized at the end of the treatment period and right ovarian tumor volume was measured (length X width X height) using calipers. All treated groups showed significantly smaller tumors than controls. P values from two-sample t tests on tumor volume are shown. E) Bioluminescence imaging was performed weekly in tumor bearing animals treated with vehicle or rapamycin. Treatment was initiated 6 weeks after AdCre injection of the right ovarian bursae of Apcflox/flox;Ptenflox/flox; ROSA26 L-S-L-luc/+ mice. Representative images before and after 4 weeks of treatment with rapamycin or vehicle are shown. Bioluminescence is indicated as photons/second/cm2. Red signals correspond to maximal intensity, violet to minimal intensity and other colors representing values in between. F) Graph showing fold-change in luciferase activity based on BLI imaging of vehicle versus rapamycin treated animals over the 4 week treatment course. G) Comparison of tumor volume and BLI signal at study endpoint in vehicle and rapamycin treated animals.
Figure 6
Figure 6. Akt inhibition in murine and human ovarian tumor cells results in compensatory activation of MEK/ERK signaling
Immunoblots of lysates from A) W2671T and W2830T and B) A2780 cells treated for 2 hr with varying doses of perifosine; C) W2671T and W2830T and D) A2780-S33Y and A2780-Neo cells treated with 40 μM API-2 over the indicated time course; E) W2830T cells treated with 100nM rapamycin for up to 24 hr. In each blot, levels of phosphorylated and total Akt, ERK, and S6 are shown.

References

    1. Seidman JD, Horkayne-Szakaly I, Haiba M, Boice CR, Kurman RJ, Ronnett BM. The histologic type and stage distribution of ovarian carcinomas of surface epithelial origin. Int J Gynecol Pathol. 2004;23:41–4. - PubMed
    1. Jemal A, Siegel R, Xu J, Ward E. Cancer statistics, 2010. CA Cancer J Clin. 2010;60:277–300. - PubMed
    1. Kurman RJ, Shih IeM. Pathogenesis of ovarian cancer: lessons from morphology and molecular biology and their clinical implications. Int J Gynecol Pathol. 2008;27:151–60. - PMC - PubMed
    1. Shih IeM, Kurman RJ. Ovarian tumorigenesis: a proposed model based on morphological and molecular genetic analysis. Am J Pathol. 2004;164:1511–8. - PMC - PubMed
    1. Seidman JD, Cho KR, Ronnett BM, Kurman RJ. Surface Epithelial Tumors of the Ovary. In: Kurman RJ, Ellenson LH, Ronnett BM, editors. Blaustein’s Pathology of the Female Genital Tract. 6. New York: Springer; 2011.

Publication types

MeSH terms