. 2011 Sep 9;333(6048):1445-9.
doi: 10.1126/science.1204697.

Chromosome organization by a nucleoid-associated protein in live bacteria

Affiliations

Chromosome organization by a nucleoid-associated protein in live bacteria

Wenqin Wang et al. Science. .

Abstract

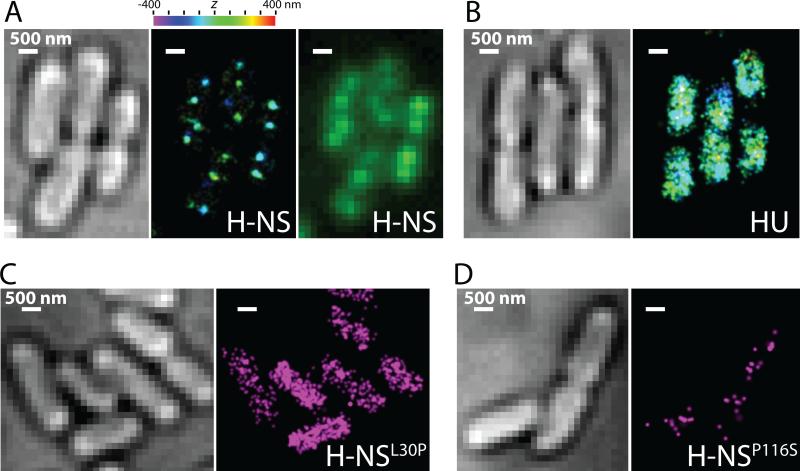
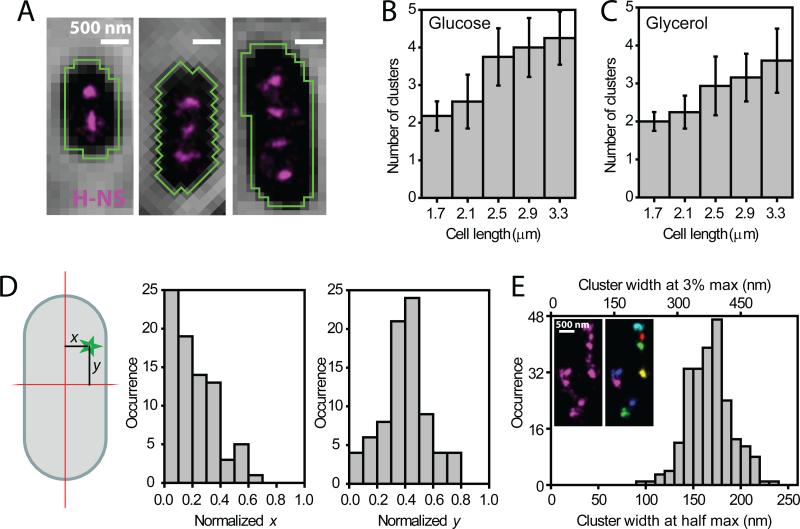
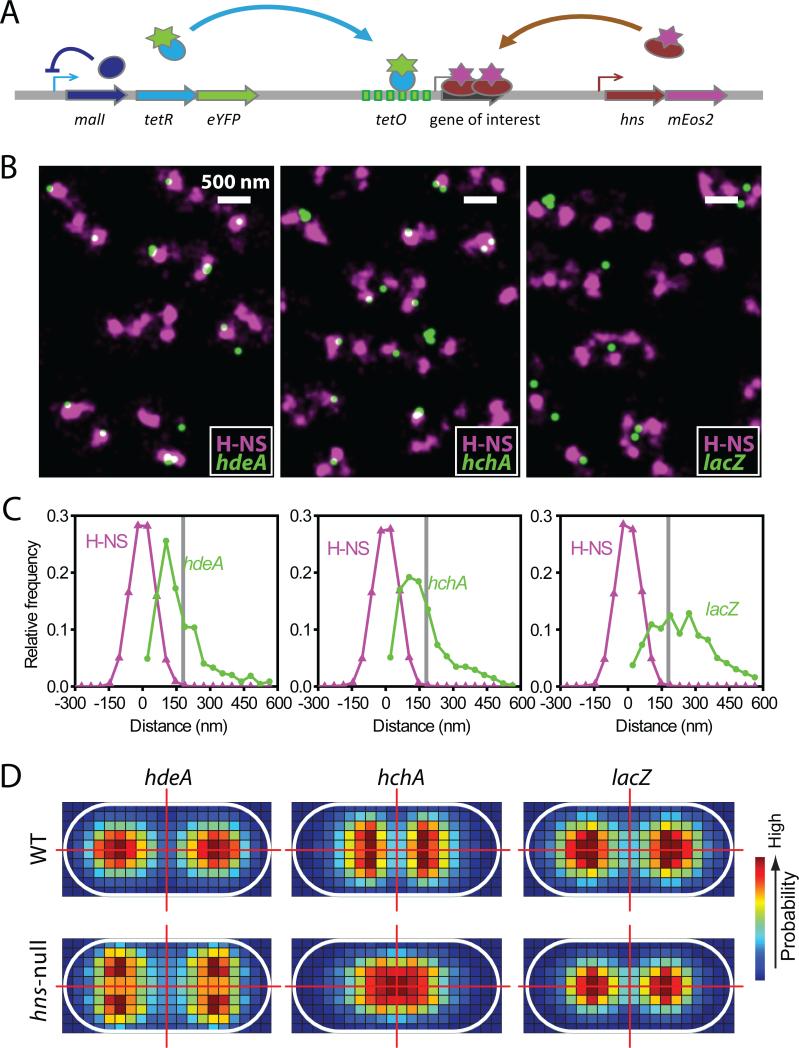
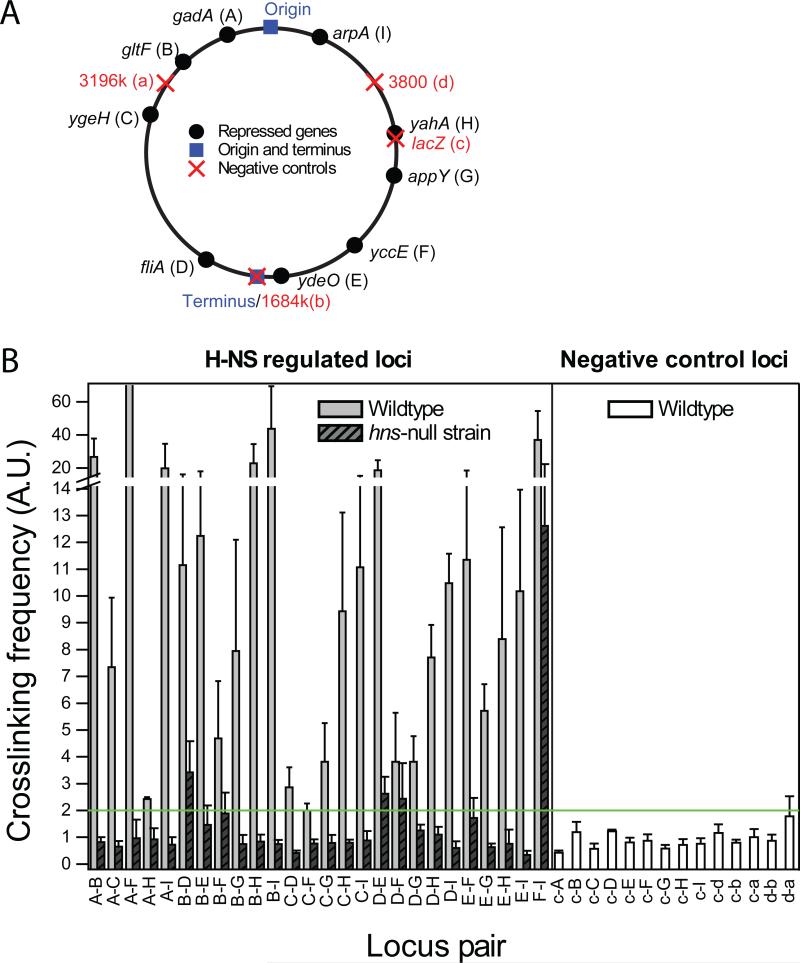
Bacterial chromosomes are confined in submicrometer-sized nucleoids. Chromosome organization is facilitated by nucleoid-associated proteins (NAPs), but the mechanisms of action remain elusive. In this work, we used super-resolution fluorescence microscopy, in combination with a chromosome-conformation capture assay, to study the distributions of major NAPs in live Escherichia coli cells. Four NAPs--HU, Fis, IHF, and StpA--were largely scattered throughout the nucleoid. In contrast, H-NS, a global transcriptional silencer, formed two compact clusters per chromosome, driven by oligomerization of DNA-bound H-NS through interactions mediated by the amino-terminal domain of the protein. H-NS sequestered the regulated operons into these clusters and juxtaposed numerous DNA segments broadly distributed throughout the chromosome. Deleting H-NS led to substantial chromosome reorganization. These observations demonstrate that H-NS plays a key role in global chromosome organization in bacteria.


Figures

Fig. 1
Fig. 1
Super-resolution imaging of major nucleoid-associated proteins in living E. coli cells. (A) Compact H-NS clusters in the nucleoid. The E. coli cells shown in the bright-field image (left) expressed photoactivatable fluorescent protein mEos2 fused to H-NS, which was imaged with sub-diffraction-limit resolution (middle). The z-coordinate of each localization in the 3D STORM image is color-coded according to the color bar. In comparison, a conventional fluorescence image of the same cells is shown (right). A time-lapse movie corresponding to the super-resolution image is shown in Movie S1 (). Due to the slow cluster movements, the images of H-NS are not motion-blurred appreciably. (B) Scattered distribution of HU in the nucleoid. Left, bright-field image. Right, 3D STORM image of mEos2-labeled HU in the same cells. Similar distributions were observed for Fis, IHF and StpA (Fig. S2) (). Fine features of the nucleoid shape could potentially be blurred by movement. (C, D) Dependence of H-NS cluster formation on its oligomerization and DNA-binding capabilities. (C) Bright field image of cells (left) and corresponding 2D super-resolution image of H-NS (right) with a point mutation, L30P, that inhibits dimerization/oligomerization. (D) Bright field image (left) and corresponding 2D super-resolution image of H-NS (right) with a point mutation, P116S, that inhibits DNA binding. Image acquisition time: 0.5 – 2 min for each image.
Fig. 2
Fig. 2
Quantitative characterizations of the H-NS clusters. (A-C) The number of clusters per cell. (A) Overlay of the phase contrast images showing the cell contours (segmentation shown in green) and the super-resolution images of H-NS (magenta) for three cells of different lengths. (B, C) The average number of clusters per cell versus the cell length is shown for different growth conditions (medium supplemented with glucose (B) or glycerol (C)). Error bars: SD (N = 28, 32, 32, 14, and 4 cells from left to right for (B) and N = 34, 49, 31, 32, and 10 cells from left to right for (C)). (D) The location of clusters. Each cluster (green) was assigned a coordinate (x, y) relative to the cell axes (left). For cells with two clusters, the distributions of cluster coordinates are plotted for x normalized to the half cell width and y normalized to the half cell length. For cells with three clusters, the (x, y) distributions are shown in Fig S5 (). (E) The size of clusters. The distribution of the full width at half maximum (FWHM, bottom axis) or full width at 3% maximum (top axis) of the clusters was determined with automated cluster identification (example image (left) and segmentation (right) shown in inset) (). Image acquisition time: 1 min.
Fig. 3
Fig. 3
Colocalization of H-NS clusters and specific gene loci. (A) Two-color imaging scheme of mEos2-labeled H-NS and eYFP-labeled gene locus as described in the text. (B) Two-color live-cell images of H-NS (magenta) and the hdeA, hchA, or lacZ loci (green), showing more extensive H-NS co-localization for hdeA and hchA. Because each blinking event of eYFP was imaged independently, a single gene locus may appear as more than one puncta. (C) Quantitative co-localization analysis between H-NS clusters and the hdeA, hchA, or lacZ loci. Green curves: the 2D-distance distributions between the gene loci and the center positions of their nearest H-NS clusters; magenta curves: the density cross-sections of these H-NS clusters aligned to their center positions. About 67% of hdeA, 65% of hchA, and 36% lacZ loci resided within the boundary of the clusters (defined by the grey lines, positioned at 3% of the peak values of the magenta curves) (). The 3% line was chosen as the cluster boundary because the background density outside the clusters was only ~1% of the peak densities. The colocalization fraction of lacZ is close to the expected background value (20-30%), derived from a random distribution of the gene locus in the nucleoid. To remove the potential artifact due to cluster size heterogeneity associated with this ensemble analysis, we performed an alternative single-locus-based analysis, which also showed that hdeA and hchA colocalized with H-NS clusters to a substantially higher degree than lacZ (). In each case, 500-700 gene locus positions were analyzed. (D) Displacement of gene loci upon H-NS deletion. Plotted are the 2D histograms of the relative hdeA, hchA, and lacZ locus positions normalized to the cell dimensions. Considering the approximate mirror symmetry of the cell shape along its long and short axes observed in the bright-field images, we placed normalized locus positions into the first quartile of the cell and then extended the probability density map into the other three quartiles by enforcing the mirror symmetry. Therefore, symmetric peaks within the cell do not necessarily reflect the presence of more than one most probable positions of the gene locus. The grid size is ~100-200 nm and the probability density is color-coded according to the color bar (right). The cell outlines are shown as white ovals and the cell axes are shown as red lines. In each case, 2000-5000 gene locus positions were analyzed.
Fig. 4
Fig. 4
Proximity between gene locus pairs probed by chromosome conformation capture (3C). (A) Nine H-NS regulated gene loci (labeled as A-I, black circles) and four negative control loci (labeled as a-d, red crosses) on the circular E. coli chromosome map. The origin and terminus of replication are marked with blue squares as position references. (B) Crosslinking frequencies between pairs of chromosome loci. The crosslinking efficiency is defined as the ratio of qPCR signals between the crosslinked sample and the non-crosslinked control. Each column represents one pair of H-NS regulated loci (grey bars), or one pair involving at least one negative control loci (white bars). The crosslinking frequencies of the hns-null cells are shown for the regulated pairs in dark grey, hashed bars. The green line marks a 2-fold difference between crosslinked and non-crosslinked cells. These data reflect the population average behavior and the proximity pattern between the gene locus pairs could vary from cell to cell. Error bars: SEM (N = 3 sets of independent experiments).

References

    1. Robinow C, Kellenberger E. Microbiol Rev. 1994;58:211. - PMC - PubMed
    1. Eltsov M, Zuber B. J Struct Biol. 2006;156:246. - PubMed
    1. Gitai Z, Thanbichler M, Shapiro L. Trends Microbiol. 2005;13:221. - PubMed
    1. Reyes-Lamothe R, Wang X, Sherratt D. Trends Microbiol. 2008;16:238. - PubMed
    1. Espeli O, Boccard F. J Struct Biol. 2006;156:304. - PubMed

Publication types

MeSH terms