. 2011 Oct;32(10):1639-51.
doi: 10.1088/0967-3334/32/10/011. Epub 2011 Sep 9.

Lack of consistent intracranial pressure pulse morphological changes during episodes of microdialysis lactate/pyruvate ratio increase

Affiliations

Lack of consistent intracranial pressure pulse morphological changes during episodes of microdialysis lactate/pyruvate ratio increase

Shadnaz Asgari et al. Physiol Meas. 2011 Oct.

Abstract

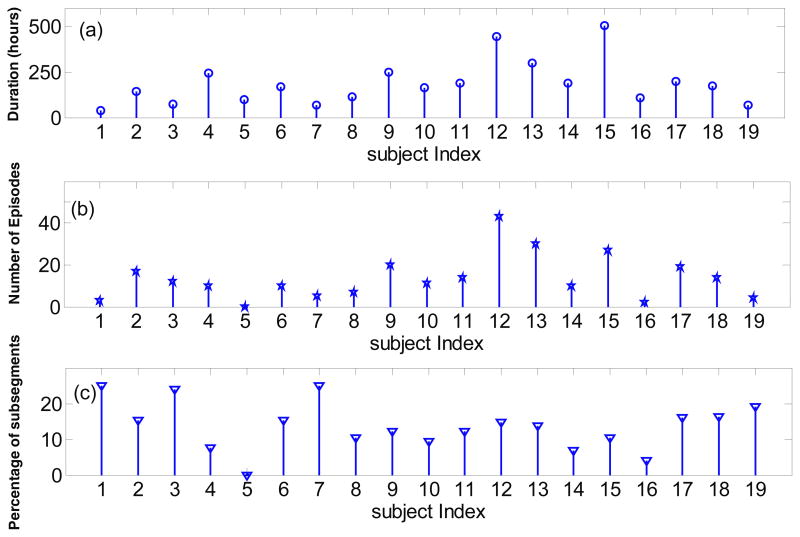
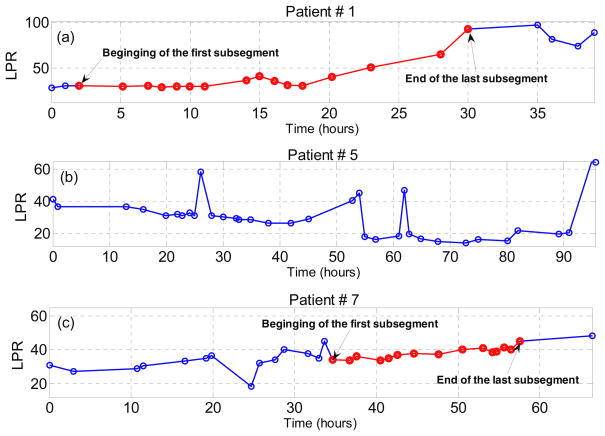
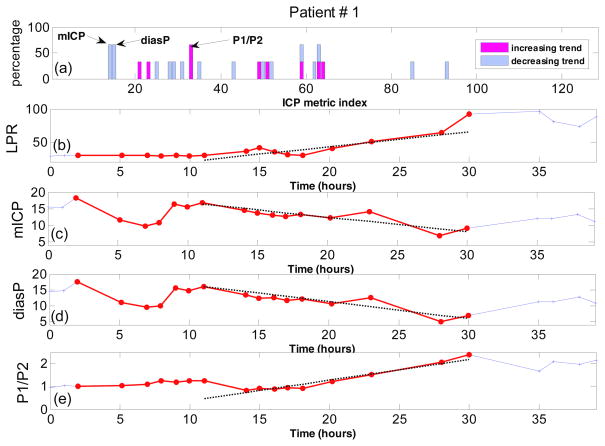
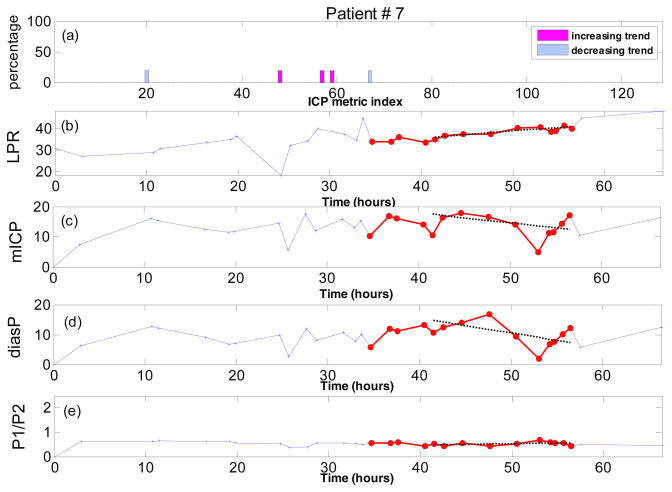
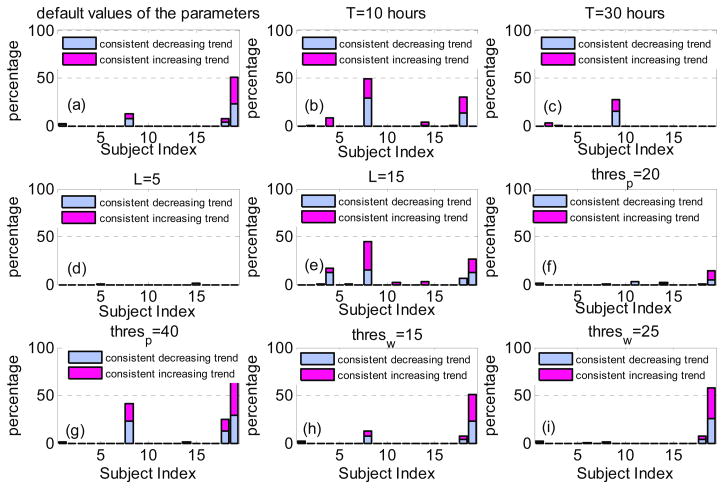
Lactate/pyruvate ratio (LPR) from microdialysis is a well-established marker of cerebral metabolic crisis. For brain injury patients, abnormally high LPR could indicate cerebral ischemia or failure of O(2) uptake. However, there is a debate on the primary factor responsible for LPR increase. Exploiting the potential of using the morphology of a high temporal resolution signal such as intracranial pulse (ICP) to characterize cerebrovascular changes, a data analysis experiment is taken to test whether consistent changes in ICP pulse morphological metrics accompany the LPR increase. We studied 3517 h of LPR and continuous ICP data from 19 severe traumatic brain injury patients. Our morphological clustering and analysis of intracranial pressure (MOCAIP) algorithm was applied to ICP pulses, which were matched in time to the LPR measurements, and 128 pulse morphological metrics were extracted. We automatically identified the episodes of LPR increases using a moving time window of 10-20 h. We then studied the trending patterns of each of the 128 ICP MOCAIP metrics within these identified periods and determined them to be one of the following three types: increasing, decreasing or no trend. A binomial test was employed to investigate whether any MOCAIP metrics show a consistent trend among all episodes of LPR increase per patient. Regardless of the selected values for different parameters of the proposed method, for the majority of the subjects in the study (78%), none of the ICP metrics show any consistent trend during the episodes of LPR increase. Even for the few subjects who have at least one ICP metric with a consistent trend during the LPR increase episodes, the number of such metrics is small and varies from subject to subject. Given the fact that ICP pulse morphology is influenced by the cerebral vasculature, our results suggest that a dominant cerebral vascular cause may be behind the changes in LPR when LPR trends correlate with ICP pulse morphological changes. However, the incidence of such correlation seems to be low.


Figures

Figure 1
Figure 1
Microdialysis data and episodes of Lactate/Pyruvate ratio (LPR) increase for all the subjects. (a) Time duration of microdialysis measurements in hours; (b) Number of the automatically identified LPR increase episodes; (c) Percentage of subsegments with length of 10 samples which are identified as an episode of LPR increase using the proposed method.
Figure 2
Figure 2
The microdialysis data (LPR) measured over the time of study for three patients. All the sample points which belong to at least one automatically identified LPR increase episodes are highlighted with the red color. (a) patient #1; (b) patient # 5; and (c) patient #7.
Figure 3
Figure 3
Trend analysis for patient #1. (a) Percentage of LPR increase episodes with increasing or decreasing trend for all 128 ICP metrics; (b) The measured LPR over the time; (c) mean ICP (mmHg) over time; (d) diastolic pressure (mmHg) over time; (e) the ratio of the first peak to the second peak of the ICP pulse over time. All the sample points which belong to at least one automatically identified LPR increase episodes are highlighted with the red color. The dotted lines on (b), (c), (d) and (e) are the regression lines robustly fitted to the corresponding data during the last identified episode of LPR increase (length of 10 samples).
Figure 4
Figure 4
Trend analysis for patient #7. (a) Percentage of LPR increase episodes with increasing or decreasing trend for all 128 ICP metrics; (b) The measured LPR over the time; (c) mean ICP (mmHg) over time; (d) diastolic pressure (mmHg) over time; (e) the ratio of the first peak to the second peak of the ICP pulse over time. All the sample points which belong to at least one automatically identified LPR increase episodes are highlighted with the red color. The dotted lines on (b), (c), (d) and (e) are the regression lines robustly fitted to the corresponding data during the last identified episode of LPR increase (length of 10 samples).
Figure 5
Figure 5
The percentage of the ICP metrics with consistent increasing (or consistent decreasing trend) for all the subjects in the study using different values of the parameters. (a)The default values of the parameters as (L = 10, T = 20, thres p = 30th percentile and thres w = 5th percentile); (b) decreasing T, ( L = 10, T = 10, thres p = 30th percentile and thres w = 5th percentile); (c) increasing T, ( L = 10, thres p, T = 30, thres p = 20th percentile and thres w = 5th percentile); (d) decreasing L, ( L = 5, T = 10, thres p = 40th percentile and thres p = 5th percentile); (e) increasing L, (L = 15, T = 10, thres p 40th percentile and thres w = 5th percentile); (f) decreasing thres p, ( L = 10, T = 10, thres p = 20th percentile and thres w = 25th percentile); (g) increasing thres p, (L = 10, T = 10, thres p = 40th percentile and thres w = 25th percentile); (h) increasing, thres w, (L = 10, T = 10, thres p = 30th percentile and thres w = 15th percentile); (i) increasing thres w, ( L = 10, T = 10, thres p = 30th percentile and thres w = 25th percentile).

References

    1. Adolph RJ, Fukusumi H, Fowler NO. Origin of cerebrospinal fluid pulsations. The American journal of physiology. 1967;212:840–6. - PubMed
    1. Asgari S, Bergsneider M, Hamilton R, Vespa P, Hu X. Consistent changes in intracranial pressure waveform morphology induced by acute hypercapnic cerebral vasodilatation. Neurocritical care. 2011;15:55–62. - PMC - PubMed
    1. Asgari S, Bergsneider M, Hu X. A robust approach toward recognizing valid arterial-blood-pressure pulses. IEEE Trans Inf Technol Biomed. 2010;14:166–72. - PMC - PubMed
    1. Asgari S, Xu P, Bergsneider M, Hu X. A subspace decomposition approach toward recognizing valid pulsatile signals. Physiological measurement. 2009;30:1211–25. - PMC - PubMed
    1. Bjerring PN, Hauerberg J, Jorgensen L, Frederiksen HJ, Tofteng F, Hansen BA, Larsen FS. Brain hypoxanthine concentration correlates to lactate/pyruvate ratio but not intracranial pressure in patients with acute liver failure. Journal of hepatology. 2010;53:1054–8. - PubMed

Publication types

LinkOut - more resources