

Dark progression reveals slow timescales for radiation damage between T = 180 and 240 K
- PMID: 21904032
- PMCID: PMC3169314
- DOI: 10.1107/S0907444911027600
Dark progression reveals slow timescales for radiation damage between T = 180 and 240 K
Abstract
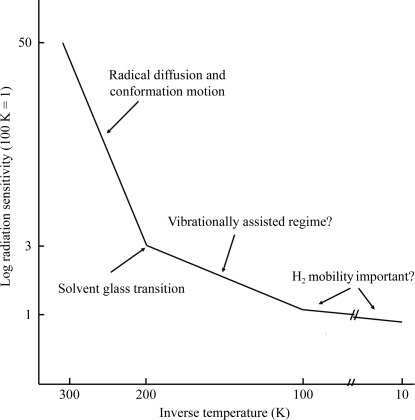
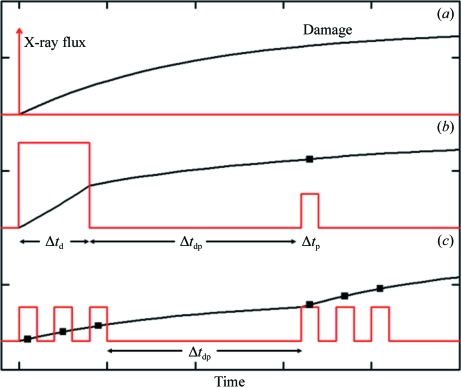
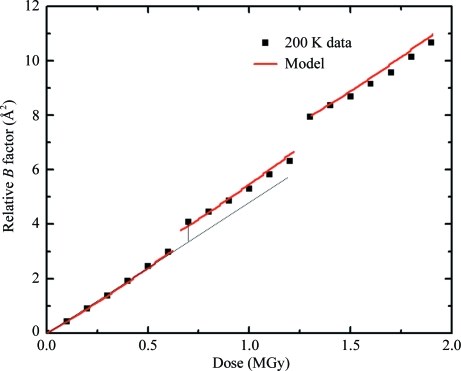
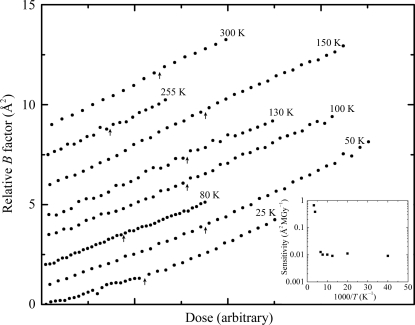
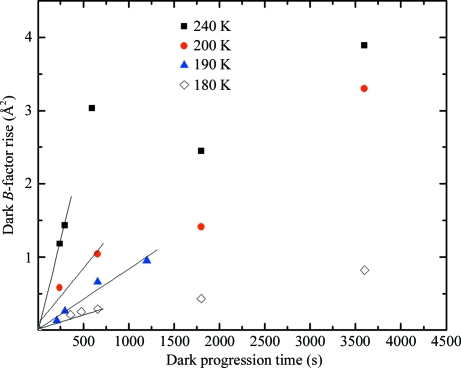
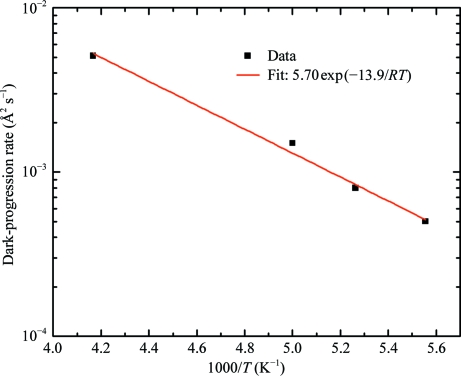
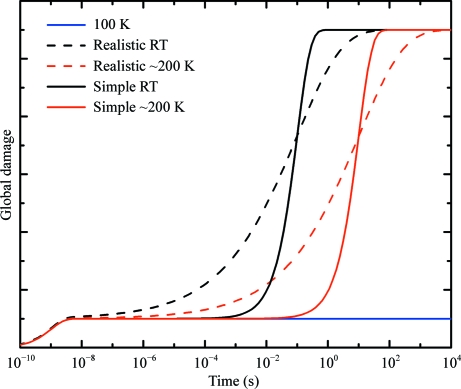
Can radiation damage to protein crystals be `outrun' by collecting a structural data set before damage is manifested? Recent experiments using ultra-intense pulses from a free-electron laser show that the answer is yes. Here, evidence is presented that significant reductions in global damage at temperatures above 200 K may be possible using conventional X-ray sources and current or soon-to-be available detectors. Specifically, `dark progression' (an increase in damage with time after the X-rays have been turned off) was observed at temperatures between 180 and 240 K and on timescales from 200 to 1200 s. This allowed estimation of the temperature-dependent timescale for damage. The rate of dark progression is consistent with an Arrhenius law with an activation energy of 14 kJ mol(-1). This is comparable to the activation energy for the solvent-coupled diffusive damage processes responsible for the rapid increase in radiation sensitivity as crystals are warmed above the glass transition near 200 K. Analysis suggests that at T = 300 K data-collection times of the order of 1 s (and longer at lower temperatures) may allow significant reductions in global radiation damage, facilitating structure solution on crystals with liquid solvent. No dark progression was observed below T = 180 K, indicating that no important damage process is slowed through this timescale window in this temperature range.
Figures
Similar articles
-
Global radiation damage: temperature dependence, time dependence and how to outrun it.J Synchrotron Radiat. 2013 Jan;20(Pt 1):7-13. doi: 10.1107/S0909049512048303. Epub 2012 Nov 29. J Synchrotron Radiat. 2013. PMID: 23254651 Free PMC article.
-
Glass transition in thaumatin crystals revealed through temperature-dependent radiation-sensitivity measurements.Acta Crystallogr D Biol Crystallogr. 2010 Oct;66(Pt 10):1092-100. doi: 10.1107/S0907444910035523. Epub 2010 Sep 18. Acta Crystallogr D Biol Crystallogr. 2010. PMID: 20944242 Free PMC article.
-
Reduction of X-ray-induced radiation damage of macromolecular crystals by data collection at 15 K: a systematic study.Acta Crystallogr D Biol Crystallogr. 2007 Mar;63(Pt 3):302-9. doi: 10.1107/S0907444906053261. Epub 2007 Feb 21. Acta Crystallogr D Biol Crystallogr. 2007. PMID: 17327667
-
Radiation Damage in Macromolecular Crystallography.Methods Mol Biol. 2017;1607:467-489. doi: 10.1007/978-1-4939-7000-1_20. Methods Mol Biol. 2017. PMID: 28573586 Review.
-
Structure Determination Using X-Ray Free-Electron Laser Pulses.Methods Mol Biol. 2017;1607:295-324. doi: 10.1007/978-1-4939-7000-1_12. Methods Mol Biol. 2017. PMID: 28573578 Review.
Cited by
-
Global radiation damage: temperature dependence, time dependence and how to outrun it.J Synchrotron Radiat. 2013 Jan;20(Pt 1):7-13. doi: 10.1107/S0909049512048303. Epub 2012 Nov 29. J Synchrotron Radiat. 2013. PMID: 23254651 Free PMC article.
-
Lifetimes and spatio-temporal response of protein crystals in intense X-ray microbeams.IUCrJ. 2017 Oct 13;4(Pt 6):785-794. doi: 10.1107/S2052252517013495. eCollection 2017 Nov 1. IUCrJ. 2017. PMID: 29123681 Free PMC article.
-
Spatial distribution of radiation damage to crystalline proteins at 25-300 K.Acta Crystallogr D Biol Crystallogr. 2012 Sep;68(Pt 9):1108-17. doi: 10.1107/S0907444912021361. Epub 2012 Aug 18. Acta Crystallogr D Biol Crystallogr. 2012. PMID: 22948911 Free PMC article.
-
Micro-crystallography comes of age.Curr Opin Struct Biol. 2012 Oct;22(5):602-12. doi: 10.1016/j.sbi.2012.09.001. Epub 2012 Sep 26. Curr Opin Struct Biol. 2012. PMID: 23021872 Free PMC article. Review.
-
Exploiting fast detectors to enter a new dimension in room-temperature crystallography.Acta Crystallogr D Biol Crystallogr. 2014 May;70(Pt 5):1248-56. doi: 10.1107/S1399004714005379. Epub 2014 Apr 26. Acta Crystallogr D Biol Crystallogr. 2014. PMID: 24816094 Free PMC article.
References
-
- Anbar, M. & Hart, E. J. (1967). J. Phys. Chem. 71, 3700–3702.
-
- Barker, A. I., Southworth-Davies, R. J., Paithankar, K. S., Carmichael, I. & Garman, E. F. (2009). J. Synchrotron Rad. 16, 205–216. - PubMed
-
- Benkovic, S. J. & Hammes-Schiffer, S. (2006). Science, 312, 208–209. - PubMed
-
- Blake, C. & Phillips, D. C. (1962). Proceedings of the Symposium on the Biological Effects of Ionizing Radiation at the Molecular Level, pp. 183–191. Vienna: International Atomic Energy Agency.
-
- Blundell, T. & Johnson, L. N. (1976). Protein Crystallography. London: Academic Press.
Publication types
MeSH terms
Substances
Grants and funding
LinkOut - more resources
Full Text Sources
