. 2011:2011:851280.
doi: 10.1155/2011/851280. Epub 2011 Aug 28.

Effect of exposure of human monocyte-derived macrophages to high, versus normal, glucose on subsequent lipid accumulation from glycated and acetylated low-density lipoproteins

Affiliations

Effect of exposure of human monocyte-derived macrophages to high, versus normal, glucose on subsequent lipid accumulation from glycated and acetylated low-density lipoproteins

Fatemeh Moheimani et al. Exp Diabetes Res. 2011.

Abstract

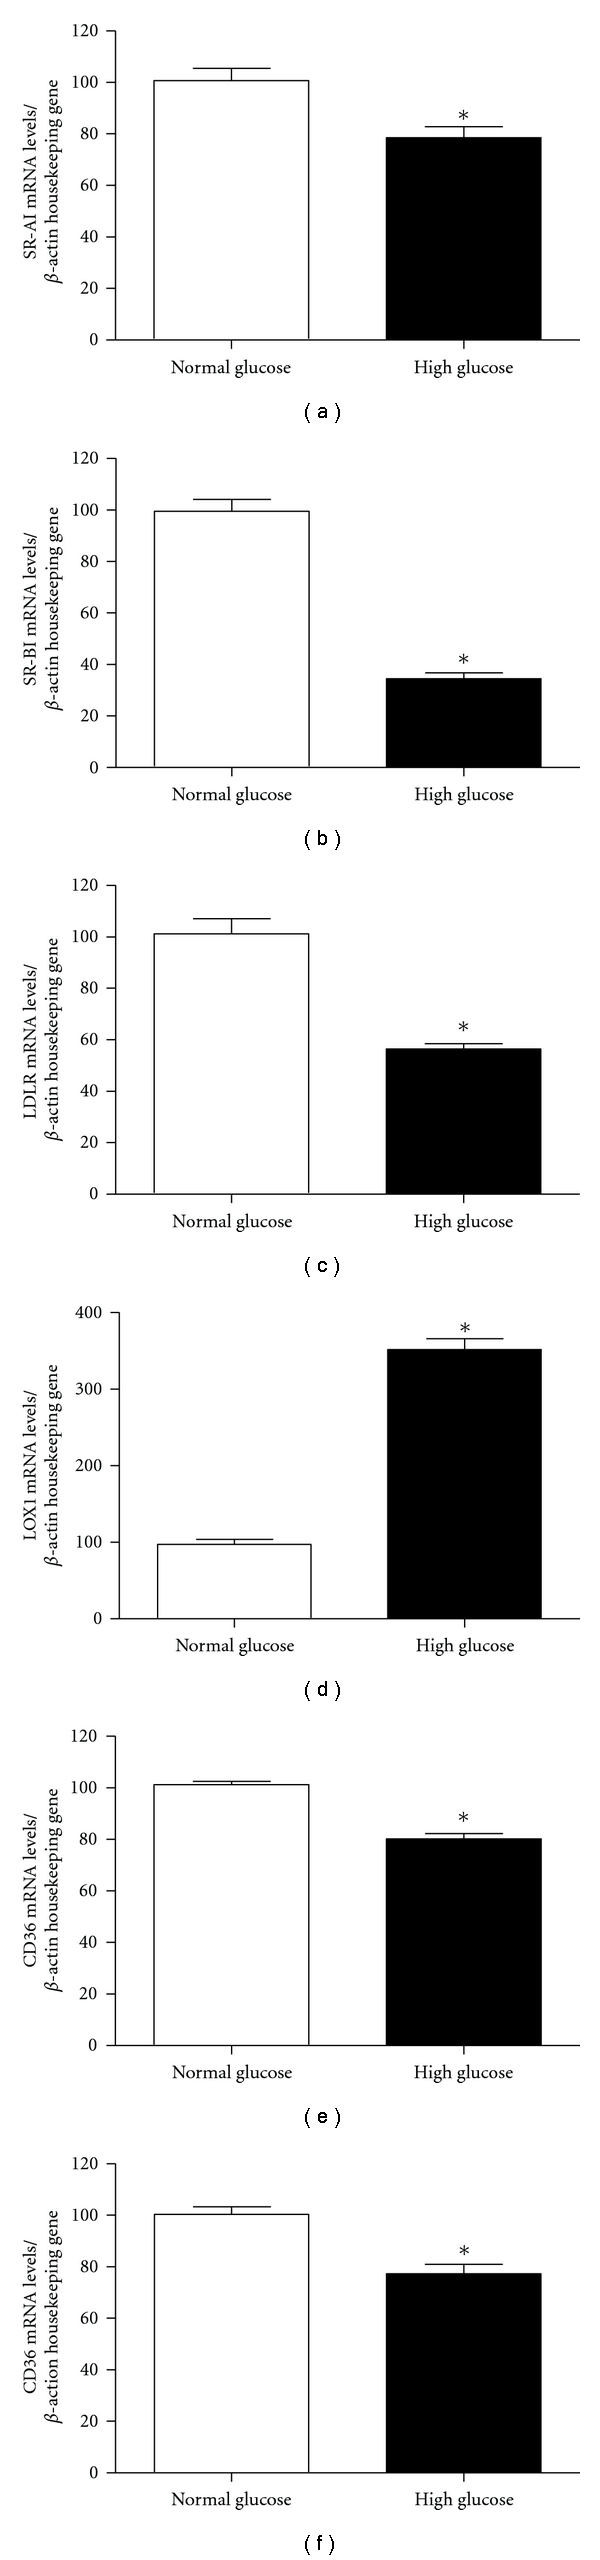
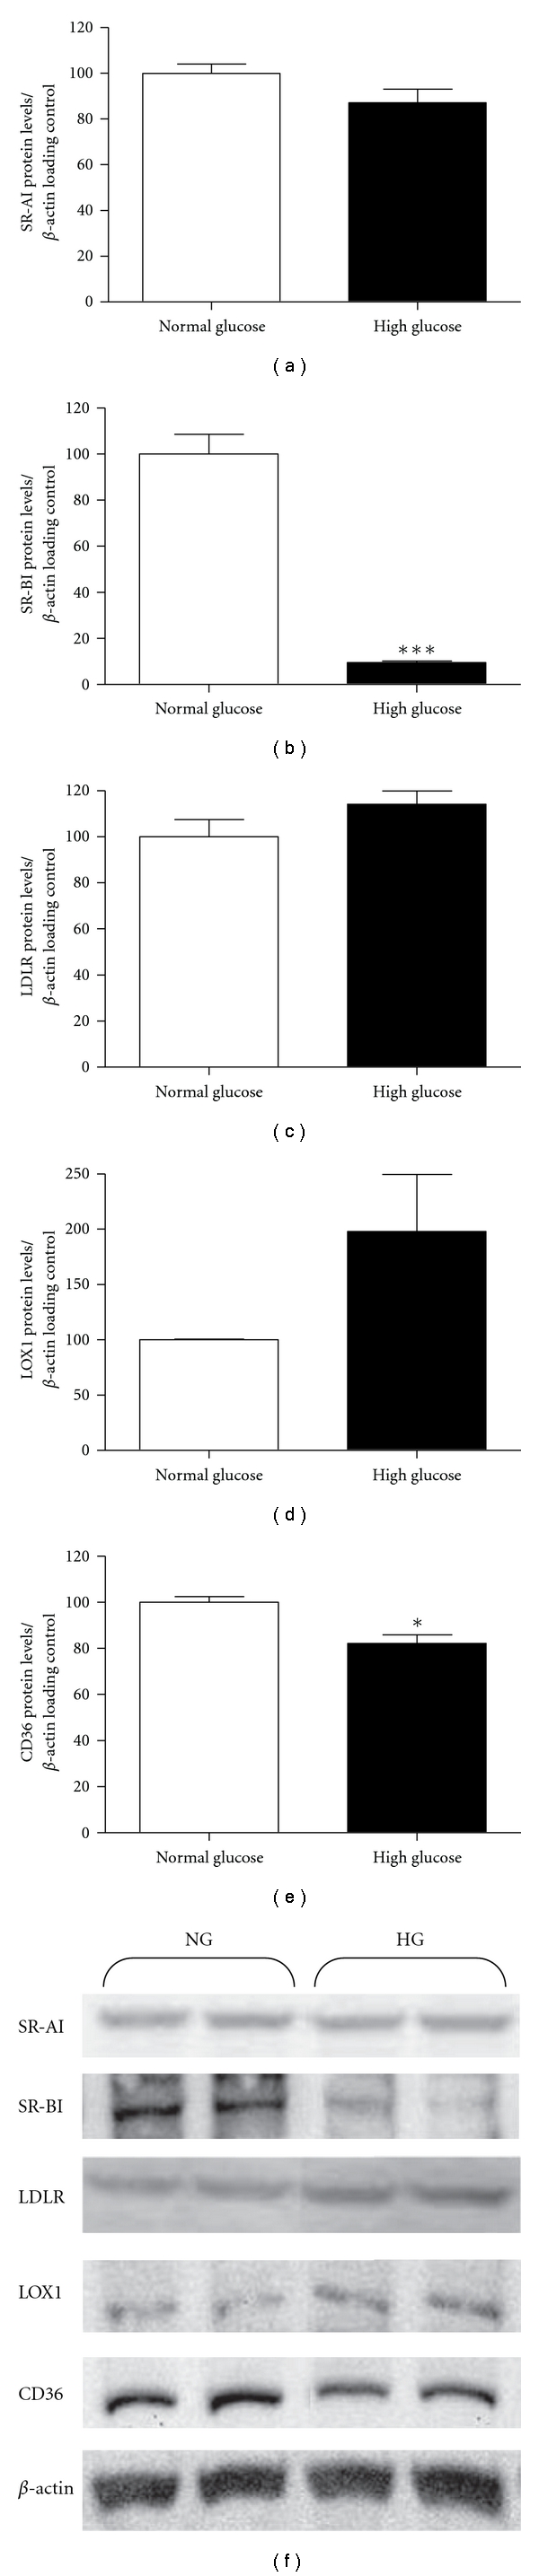
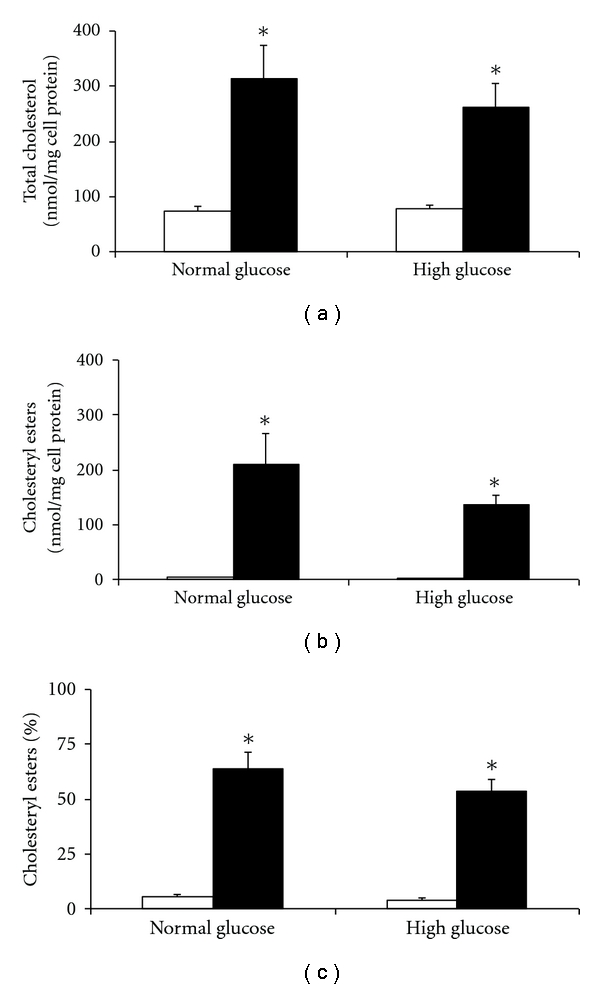
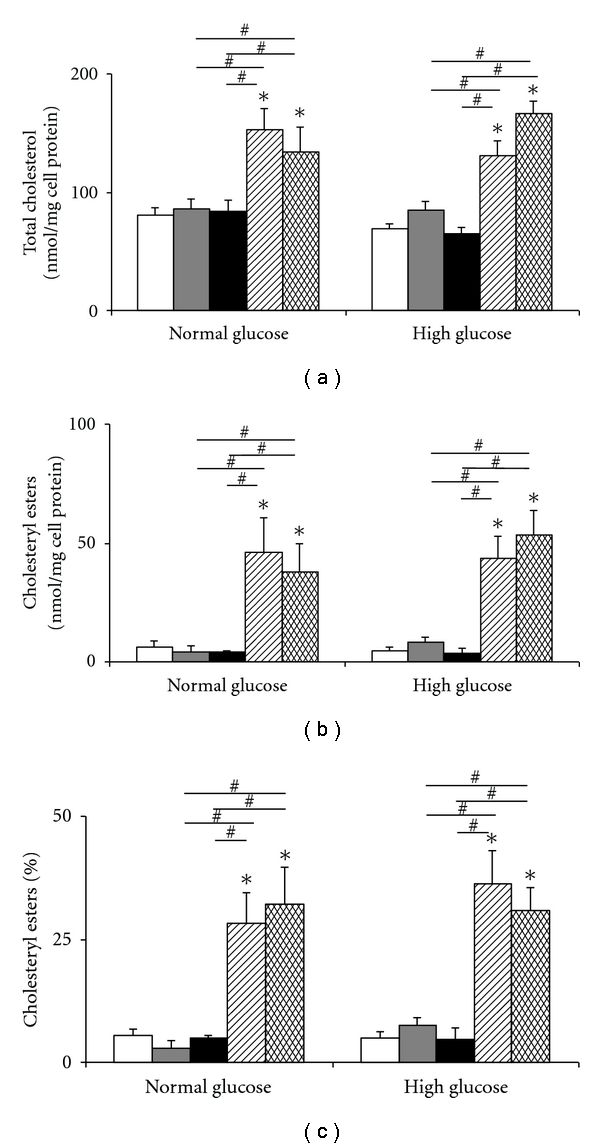
During atherosclerosis monocyte-derived macrophages accumulate cholesteryl esters from low-density lipoproteins (LDLs) via lectin-like oxidised LDL receptor-1 (LOX-1) and class AI and AII (SR-AI, SR-AII) and class B (SR-BI, CD36) scavenger receptors. Here we examined the hypothesis that hyperglycaemia may modulate receptor expression and hence lipid accumulation in macrophages. Human monocytes were matured into macrophages in 30 versus 5 mM glucose and receptor expression and lipid accumulation quantified. High glucose elevated LOX1 mRNA, but decreased SR-AI, SR-BI, LDLR, and CD36 mRNA. SR-BI and CD36 protein levels were decreased. Normo- and hyperglycaemic cells accumulated cholesteryl esters from modified LDL to a greater extent than control LDL, but total and individual cholesteryl ester accumulation was not affected by glucose levels. It is concluded that, whilst macrophage scavenger receptor mRNA and protein levels can be modulated by high glucose, these are not key factors in lipid accumulation by human macrophages under the conditions examined.


Figures

Figure 1
Figure 1
Gene expression data for (a) SR-AI, (b) SR- BI, (c) LDLR, (d) LOX1, and (e) CD36 from HMDM matured in either 5 mM (white bars) or 30 mM glucose (black bars) as measured by real-time quantitative PCR. Data (mean + SEM from n = 3 independent experiments) are expressed as a percentage change from the 5 mM concentration, which was set as 100%. *P < 0.05 for the 30 mM glucose concentration versus the 5 mM, using two-tailed unpaired t-tests.
Figure 2
Figure 2
Protein levels (mean + SEM from n = 3 independent experiments) for (a) SR-AI, (b) SR-BI, (c) LDLR, (d) LOX1, and (e) CD36 from HMDM matured in either 5 mM (white bars) or 30 mM glucose (black bars), expressed as a percentage change from the 5 mM concentration (set as 100%). (f) Representative Western immunoblots (from three independent experiments) of 5 mM (NG) and 30 mM (HG) samples. *P < 0.05 for the 30 mM concentration versus the 5 mM using two-tailed unpaired t-tests.
Figure 3
Figure 3
Relative electrophoretic mobility (REM) of unmodified (native) LDL (set as 1), LDL incubated with EDTA (EDTA-LDL), acetylated LDL (AcLDL), and LDL glycated by reactive aldehydes (glycolaldehyde, GA; methylglyoxal, MGO) at the indicated concentrations. Letters above bars indicate statistically significant differences at the P < 0.05 level for the following comparisons: “a” compared to native-LDL; “b” compared to EDTA-LDL; “c” compared to Ac-LDL; “d” compared to GA(10 mM)-LDL; “e” compared to GA(50 mM)-LDL; “f” compared to GA(100 mM)-LDL.
Figure 4
Figure 4
Effect of maturation in 5 versus 30 mM glucose on the accumulation of total cholesterol (a) and cholesteryl esters (b) and percentage cholesteryl esters (c), quantified by mass using HPLC, in HMDM cells after exposure to acetylated LDL (black bars) or control (no LDL, white bars). Data are mean ± SEM from four independent experiments. *P < 0.05, using one-way ANOVA and Newman-Keuls multiple comparison test. No differences between HMDM matured in normal and high glucose concentrations were observed for any of the data.
Figure 5
Figure 5
Effect of maturation in 5 versus 30 mM glucose on the accumulation of total cholesterol (a), cholesteryl esters (b) and percentage cholesteryl esters (c), quantified by mass using HPLC, in HMDM cells after exposure to native LDL (white bars), incubation control LDL (LDL incubated with EDTA: EDTA-LDL, gray bars), or modified LDL preglycated with 10 (black bars), 50 (striped bars) or 100 mM (hatched bars) glycolaldehyde. Data are mean ± SEM of three or more experiments. *P < 0.05, and # P < 0.05 as compared to other treatments, using one-way ANOVA and Newman-Keuls multiple comparison test.

Similar articles

Cited by

References

    1. World Health Organisation. Diabetes. Fact Sheet No. 312, 2006.
    1. Jenkins AJ, Best JD, Klein RL, Lyons TJ. Lipoproteins, glycoxidation and diabetic angiopathy. Diabetes/Metabolism Research and Reviews. 2004;20(5):349–368. - PubMed
    1. Diabetes Control and Complications Trial. Intensive diabetes treatment and cardiovascular disease in patients with type 1 diabetes. The New England Journal of Medicine. 2005;353(25):2643–2655. - PMC - PubMed
    1. Brownlee M. Biochemistry and molecular cell biology of diabetic complications. Nature. 2001;414(6865):813–820. - PubMed
    1. Ahmed N. Advanced glycation endproducts—role in pathology of diabetic complications. Diabetes Research and Clinical Practice. 2005;67(1):3–21. - PubMed

Publication types

MeSH terms

LinkOut - more resources