. 2011;6(8):e23972.
doi: 10.1371/journal.pone.0023972. Epub 2011 Aug 31.

Intradermal indocyanine green for in vivo fluorescence laser scanning microscopy of human skin: a pilot study

Affiliations

Intradermal indocyanine green for in vivo fluorescence laser scanning microscopy of human skin: a pilot study

Constanze Jonak et al. PLoS One. 2011.

Abstract

Background: In clinical diagnostics, as well as in routine dermatology, the increased need for non-invasive diagnosis is currently satisfied by reflectance laser scanning microscopy. However, this technique has some limitations as it relies solely on differences in the reflection properties of epidermal and dermal structures. To date, the superior method of fluorescence laser scanning microscopy is not generally applied in dermatology and predominantly restricted to fluorescein as fluorescent tracer, which has a number of limitations. Therefore, we searched for an alternative fluorophore matching a novel skin imaging device to advance this promising diagnostic approach.

Methodology/principal findings: Using a Vivascope®-1500 Multilaser microscope, we found that the fluorophore Indocyanine-Green (ICG) is well suited as a fluorescent marker for skin imaging in vivo after intradermal injection. ICG is one of few fluorescent dyes approved for use in humans. Its fluorescence properties are compatible with the application of a near-infrared laser, which penetrates deeper into the tissue than the standard 488 nm laser for fluorescein. ICG-fluorescence turned out to be much more stable than fluorescein in vivo, persisting for more than 48 hours without significant photobleaching whereas fluorescein fades within 2 hours. The well-defined intercellular staining pattern of ICG allows automated cell-recognition algorithms, which we accomplished with the free software CellProfiler, providing the possibility of quantitative high-content imaging. Furthermore, we demonstrate the superiority of ICG-based fluorescence microscopy for selected skin pathologies, including dermal nevi, irritant contact dermatitis and necrotic skin.

Conclusions/significance: Our results introduce a novel in vivo skin imaging technique using ICG, which delivers a stable intercellular fluorescence signal ideal for morphological assessment down to sub-cellular detail. The application of ICG in combination with the near infrared laser opens new ways for minimal-invasive diagnosis and monitoring of skin disorders.


Conflict of interest statement

Competing Interests: The authors have read the journal's policy and have the following conflicts: Pulsion Medical Systems provided some of the fluorescent dye for free. There are no patents, products in development or marketed products to declare. This does not alter the authors' adherence to all the PLoS ONE policies on sharing data and materials. The Austrian Federal Reserve Bank, is a public institution in Austria providing funding for research without any commercial interests or any potentially biasing relation to the authors.

Figures

Figure 1
Figure 1. Absorbance and fluorescence emission spectra of ICG and fluorescein.
A) ICG was dissolved in distilled water at a concentration of 3 µg/ml and the absorbance (grey cycles) was measured on a Hitachi U-2000 spectrophotometer. The same solution was used to record an emission wavelength scan of ICG on a Hitachi F4500 fluorometer (at an excitation of 633 nm). Spectra are normalized to the peak values. The laser line used for confocal fluorescence microscopy is indicated with a red line; the band of the detection channel is marked by a red transparent rectangle. B) Absorbance (dashed line) and fluorescence (continuous line) spectra of fluorescein. The exciting argon-laser line (488 nm) of the microscopy device is indicated by a blue line. The band of the detection channel is indicated by a green transparent rectangle. Data was derived from the Invitrogen spectra database (http://www.invitrogen.com/site.gateway.html?type=spectra&fileId=1300ph9).
Figure 2
Figure 2. Macroscopic image of the ICG injection site and representative confocal fluorescence image.
A) The injection site was imaged immediately after injection of 20 µl ICG solution by a dermatoscopic camera included in the Vivascope system. The square in the green injection area indicates the site of fluorescence microscopy shown in B. B) Representative confocal fluorescence image at a depth of 18 µm, 20 min after the injection.
Figure 3
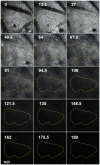
Figure 3. Montage of an image stack.
Every third image of an image stack (site depicted in previous Fig. 2B) is shown with the depth of the slice (in µm) indicated by white numbers. The yellow boundary indicates a representative area of image analysis.
Figure 4
Figure 4. Quantification of the fluorescence intensities at different time points after fluorescein or ICG injection.
Fluorescence intensities of representative areas (as shown in Fig. 3) were measured with ImageJ as described in the Methods section and are plotted against the depth of the image slice in µm. For fluorescein five individuals were imaged with three regions, each (n = 15), for ICG nine individuals were tested with three regions, each. Error bars represent SEM.
Figure 5
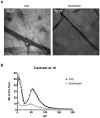
Figure 5. Comparison between fluorescein and ICG images with respect to contrast 1 h after injection.
A) Representative images at 13.5 µm depth. B) Quantification of the contrast (as given by the SD of the fluorescence intensity).
Figure 6
Figure 6. Kinetics of ICG fluorescence intensity up to 48 h.
While fluorescein fluorescence was hardly detectable 2 h after injection, ICG fluorescence was still well visible 48 h after the injection. Four representative time points are indicated (n = 27, error bars represent SEM).
Figure 7
Figure 7. There is only a limited extent of bleaching within 48 h.
ICG fluorescence is shown 48 h after injection for an area that was exposed to daylight and subject to repetitive scanning (at 2 min, 20 min, 1 h, 2 h, 4 h, 8 h, 24 h and 48 h) – or an area that was covered for 48 h before imaging to protect it from bleaching.
Figure 8
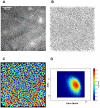
Figure 8. Automated cell recognition and analysis using CellProfiler.
A) Representative confocal fluorescence image of the stratum spinosum after ICG-injection. B) Outline of the cell borders after the cell recognition by the CellProfiler software. C) Objects identified by CellProfiler. D) Density plot of cell area versus form factor (circularity) after analysis of 108000 objects (from 59 images) using CellProfiler Analyst.
Figure 9
Figure 9. In vivo confocal laser scan of a dermal nevus after intradermal ICG injection.
A) and B) Scan of a dermal nevus 33 µm below the stratum corneum in reflectance mode (A) and in fluorescence mode (B): red arrows are indicating uniform bright cells with bright cytoplasm and central small dark nuclei (A); fluorescence mode reveals a negative pattern of these nevocytes (B); red asterisks are indicating keratinocytes of the stratum spinosum in both modes (A and B); in fluorescence mode (B) the intercellular distribution of the dye exhibits a well-defined morphology of singular cells in the stratum spinosum which can only be evaluated in the fluorescence mode; yellow asterisk is indicating a precise cellular pattern which cannot be detected in the reflectance mode scanning. C) and D) Confocal scan of a dermal nevus 34.5 µm below the stratum corneum in reflectance mode (C) and in fluorescence mode (D); dermal cell clusters are indicated by arrows; (C) displays bright cells and (D) a negative pattern of these cells; asterisks are indicating a dermal papilla: revealing a hyperrefractile dermal papillary ring (C) but this edged papilla cannot be detected in fluorescence mode (D). E) and F): Laser scan of a dermal nevus 63 µm below the stratum corneum in reflectance mode (E) and in fluorescence mode (F); dermal cell clusters are indicated by red arrows and yellow asterisks revealing a sharp negative pattern of nevocytes (F); yellow arrows are indicating blood vessels (F) ; blue arrows and blue asterisks are indicating the corresponding sites (E) in comparison to the yellow symbols (F) displaying no detectable signal of cell structures.
Figure 10
Figure 10. In vivo confocal laser scan of a contact dermatitis area.
A) and B): Laser scan of an irritant contact dermatitis at the spinous layer/DEJ in reflectance mode (A) and in fluorescence mode (B) after ICG injection intradermally; epidermal spongiosis is indicated by red arrows (A and B); a yellow asterisk marks a structure, which is indistinguishable from spongiosis in the reflectance mode (A) but which is clearly identified as dermal papilla in ICG-mediated fluorescence microscopy (B).
Figure 11
Figure 11. Confocal microscopy of a necrotic lesion.
A): Mosaic image of stitched scans of a necrosis due to KTP-laser treatment 7.5 µm below the stratum corneum after ICG injection intradermally in fluorescence mode; the red square indicates the scanning location for (B) and (C); B) reveals a normal honeycomb pattern of the stratum granulosum in reflectance mode; C) the border of necrotic and viable cells is clearly visible by the strong fluorescence of the necrotic cells, which lost their barrier function (the border is indicated by red arrows in the fluorescence mode.

References

    1. Branzan AL, Landthaler M, Szeimies RM. In vivo confocal scanning laser microscopy in dermatology. Lasers Med Sci. 2007;22:73–82. - PubMed
    1. Ulrich M, Stockfleth E, Roewert-Huber J, Astner S. Noninvasive diagnostic tools for nonmelanoma skin cancer. Br J Dermatol. 2007;157(Suppl 2):56–58. - PubMed
    1. Wurm EM, Curchin CE, Soyer HP. Recent advances in diagnosing cutaneous melanomas. F1000 Med Rep. 2010;2 - PMC - PubMed
    1. Gonzalez S, Gilaberte-Calzada Y. In vivo reflectance-mode confocal microscopy in clinical dermatology and cosmetology. Int J Cosmet Sci. 2008;30:1–17. - PubMed
    1. Ulrich M, Krueger-Corcoran D, Roewert-Huber J, Sterry W, Stockfleth E, et al. Reflectance confocal microscopy for noninvasive monitoring of therapy and detection of subclinical actinic keratoses. Dermatology. 2010;220:15–24. - PubMed

Publication types

Substances