. 2011 Sep;70(3):454-64.
doi: 10.1002/ana.22479.

Neuron-restrictive silencer factor-mediated hyperpolarization-activated cyclic nucleotide gated channelopathy in experimental temporal lobe epilepsy

Affiliations

Neuron-restrictive silencer factor-mediated hyperpolarization-activated cyclic nucleotide gated channelopathy in experimental temporal lobe epilepsy

Shawn McClelland et al. Ann Neurol. 2011 Sep.

Abstract

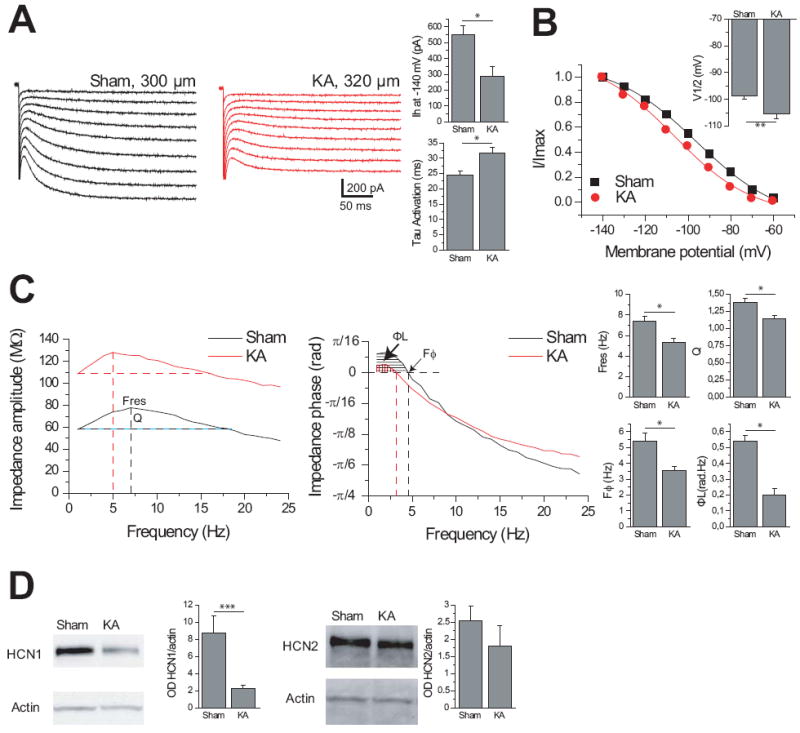
Objective: Enduring, abnormal expression and function of the ion channel hyperpolarization-activated cyclic adenosine monophosphate gated channel type 1 (HCN1) occurs in temporal lobe epilepsy (TLE). We examined the underlying mechanisms, and investigated whether interfering with these mechanisms could modify disease course.

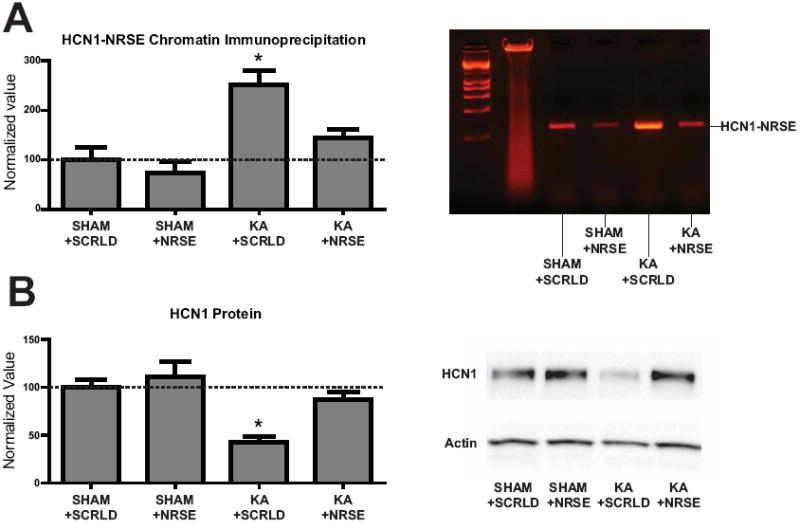
Methods: Experimental TLE was provoked by kainic acid-induced status epilepticus (SE). HCN1 channel repression was examined at mRNA, protein, and functional levels. Chromatin immunoprecipitation was employed to identify the transcriptional mechanism of repressed HCN1 expression, and the basis for their endurance. Physical interaction of the repressor, NRSF, was abolished using decoy oligodeoxynucleotides (ODNs). Video/electroencephalographic recordings were performed to assess the onset and initial pattern of spontaneous seizures.

Results: Levels of NRSF and its physical binding to the Hcn1 gene were augmented after SE, resulting in repression of HCN1 expression and HCN1-mediated currents (I(h) ), and reduced I(h) -dependent resonance in hippocampal CA1 pyramidal cell dendrites. Chromatin changes typical of enduring, epigenetic gene repression were apparent at the Hcn1 gene within a week after SE. Administration of decoy ODNs comprising the NRSF DNA-binding sequence (neuron restrictive silencer element [NRSE]), in vitro and in vivo, reduced NRSF binding to Hcn1, prevented its repression, and restored I(h) function. In vivo, decoy NRSE ODN treatment restored theta rhythm and altered the initial pattern of spontaneous seizures.

Interpretation: Acquired HCN1 channelopathy derives from NRSF-mediated transcriptional repression that endures via chromatin modification and may provide insight into the mechanisms of a number of channelopathies that coexist with, and may contribute to, the conversion of a normal brain into an epileptic one.


Figures

Fig 1
Fig 1
Loss of HCN1 protein in hippocampal CA1, and of Ih current, resonance and temporal coding in CA1 pyramidal cell distal dendrites in KA-treated animals. Ih current was decreased and the activation time constant was slower (A). The left panel shows typical examples of Ih activation in distal dendrites. The membrane potential for half activation was shifted to hyperpolarized values in KA-treated animals (B). The displayed activation curves correspond to the dendrites recorded in A. (C) Left panel: The impedance magnitude profile as a function of input frequency shows the decrease in resonance in KA-treated animals. The same dendrites as in (A and B) were hyperpolarized to -70 mV by steady current injection. The vertical dotted lines indicate the resonance frequency (Fres) at which the impedance reaches a maximum. Q is the amplification ratio between the impedance at Fres and at 1 Hz. Q and Fres were decreased in KA-treated animals (right panels). The impedance at 1 Hz was larger in KA-treated than in sham because of the increase in input resistance due to loss of Ih (Supplementary Table 1). Middle panel: Impedance phase profiles. Each curve is characterized by two regions, one with a positive impedance phase (phase lead, shaded regions), followed by a negative impedance phase (phase lag) as the frequency increases. In the phase lead (lag) regions, the membrane response appears to precede (follow) the current inputs (Supplementary Fig 1). Vertical lines indicate the crossover frequency, Fϕ. The shaded regions represent the total inductive phase ФL. Fϕ and ФL were decreased in KA-treated animals (right panels). (D) Western blots from hippocampal CA1 homogenates collected 48 hours after seizure initiation from Sham and KA treated rats, demonstrate a reduction in HCN1 protein expression (Sham 8.75 ± 2.02 normalized OD, n=8; KA 2.23 ± 0.37 normalized OD, n=6; p=0.02; normalized with actin levels), but not HCN2 protein expression, in KA-treated animals (Sham 2.53 ± 0.59 normalized OD, n=4; KA 1.79 ± 0.43 normalized OD, n=3; p=0.34; normalized with actin levels). (single asterisk, P < 0.01; double asterisk, P < 0.05; triple asterisk, P < 0.0001).
Fig 2
Fig 2
NRSE-sequence oligonucleotides (ODNs) block the downregulation of HCN1 channels by KA-induced seizure-like events in hippocampal organotypic slice cultures. (A) The hcn1 gene contains a highly conserved NRSF recognizing element (NRSE) within its first intron, as apparent from the aligned element in three species. Numbers refer to the location of a nucleotide from the gene origin; upper case letters indicate nucleotide bases considered important for NRSF binding; and stars indicate matches to the putative left and right half-site binding motifs for NRSF. (B) Western blots of organotypic hippocampal slice culture tissue homogenates collected 48 hours after KA treatment and the resulting seizure-like network activity, compared with control cultures (CTL). A significant reduction (KA 77.33 ± 2.96 % of CTL OD, n=3 per group; p=0.01) of HCN1 protein expression (normalized for actin) is apparent in the KA group, but there is no significant change in HCN2 expression (KA 106.90 ± 4.27 % of CTL OD, n=3 per group; p=0.25). (C) Western blots of nuclear protein extracts of similarly treated organotypic slice cultures demonstrated a significant increase (CTL 2.14 ± 0.03 OD, n=3; KA 3.98 ± 0.51 OD, n=6; p=0.04) in the protein levels of the transcription factor NRSF as a result of the KA-induced seizure-like events. (D) Schematic of the intervention strategy. Left panel. NRSF binds to the NRSE sequence of hcn1, resulting in its repression, and this binding is not influenced by the presence of random-sequence (scrambled; SCRLD) ODNs with a modified backbone to enhance their stability. Right panel. Decoy’ deoxyoligonucleotides (ODNs) consisting of the NRSE sequence bind to available nuclear NRSF and consequently limit the interaction of this repressor with NRSE sequences within the DNA of target genes. (E, F) Application of NRSE-sequence ODNs to hippocampal organotypic slice cultures after a three-hour KA treatment prevented the reduction in HCN1 mRNA (CTL+SCRLD 281.0 ± 9.6 nCi/g, n=5; CTL+NRSE 292.4 ± 13.1 nCi/g, n=8; KA+SCRLD 203.6 ± 15.5 nCi/g, n=7; KA+NRSE 260.3 ± 12.4 nCi/g, n=12; p=0.03 KA+SCRLD compared with CTL+SCRLD) (E) and protein (CTL+SCRLD 0.50 ± 0.06 normalized OD, n=4; CTL+NRSE 0.58 ± 0.03 normalized OD, n=3; KA+SCRLD 0.35 ± 0.04 normalized OD, n=4; KA+NRSE 0.50 ± 0.03 normalized OD, n=3; p=0.04 KA+SCRLD compared with CTL+SCRLD; all normalized with actin levels) (F) expression. The KA-induced repression was still apparent in the presence of SCRLD ODNs. Application of NRSE and SCRLD ODNs had no significant effect on the basal expression of HCN1 mRNA and protein in control cultures.
Fig 3
Fig 3
NRSF levels increase following epilepsy-provoking seizures, and promote binding of the repressor to the hcn1 gene. (A) When measured two days later, KA-induced seizures resulted in a large increase of NRSF protein levels in nuclear extracts of hippocampi (sham 1.95 ± 0.07 OD, n=4; KA 6.39 ± 0.11 OD, n=4). (B) When measured two days later, pilocarpine-induced seizures also resulted in a two-fold increase of NRSF protein in nuclear extracts of hippocampi (sham 2.03 ± 0.42 OD, n=6; pilocarpine 3.96 ± 0.52 OD, n=5). (C) Schematic of the hcn1 gene indicating the location of the NRSE and of the primer sets for PCR used in chromatin immunoprecipitation. (D, E) Chromatin immunoprecipitation (ChIP) using an antiserum to NRSF (H290, Santa Cruz) compared to IgG for precipitating the DNA-protein complex. Tissue was obtained from rats two days after the KA treatment, and quantitative PCR of input and immunoprecipitated DNA was used to calculate the percent of input DNA recovered. (D) Augmented specific immunoprecipitation of DNA comprising the HCN1-NRSE region is apparent when the NRSF antiserum rather than IgG, is used: (IgG 0.207 ± 0.021 %, n=4; NRSF 0.342 ± 0.016 %, n=4). (E) This augmented binding of NRSF, detected via anti NRSF precipitation, was selective to DNA of NRSE-containing regions, and was not found for an NRSE-lacking region 1600bp downstream of the HCN1-NRSE (IgG 0.237 ± .039 %, n=7; NRSF 0.230 ± 0.059 %, n=7). (F) KA-induced seizures resulted in a large increase in NRSF binding to the HCN1-NRSE region when measured three days later (Sham 100 ± 16, n=4; KA 233 ± 18, n=4). (single asterisk, P < 0.05).
Fig 4
Fig 4
Abrogation of NRSF binding and recovery of HCN1 expression following NRSE-ODN infusion in vivo (A), left panel: Infusion of NRSE-ODNs abrogated the KA-induced increase of NRSF binding to the hcn1 gene. A large increase in NRSF binding near the HCN1-NRSE region was found only in KA treated rats receiving scrambled-ODN (SHAM+SCRLD 100 ± 25 n=3, SHAM+NRSE-ODN 73 ± 25, n=4; KA+SCRLD 251 ± 28, n=5; KA+NRSE-ODN 145 ± 16, n=4). An example of a complete gel showing PCR products from the ChIP is shown in the second panel, illustrating these differences. (B) NRSE-ODN, but not scrambled-ODN treatment, prevented the KA-induced repression of HCN1 expression. Normalized values of SHAM+SCRLD: 100 ± 8 (n=5); SHAM+NRSE-ODN: 111 ± 16 (n=6); KA+SCRLD: 43 ± 6 (n=7); KA+NRSE-ODN: 87 ± 9 (n=7). A representative western blot including all experimental groups is shown in the second panel. (single asterisk, P < 0.05)
Fig 5
Fig 5
Recovery of Ih function following NRSE-ODN injection in vivo and specificity of NRSE-ODN treatment. (A) NRSE-ODN, but not scrambled-ODN treatment, restored Ih amplitude and channel kinetics (for both activation time constant and membrane potential for half-maximal activation, V1/2). Averaged activation curves are shown for KA+NRSE (n=7) and KA+SCRLD (n=8) experiments. Errors bars (s.e.m) are hidden in the symbols. (B) NRSE-ODN, but not scrambled-ODN treatment, restored theta resonance and temporal coding. Resonance and phase response were voltage-dependent, and were reduced at -60 mV as compared to -70 mV. There were no significant differences between Sham and KA+NRSE values, as well as between KA+saline and KA+SCRLD values. (C) Time course of NRSF protein levels in hippocampus of KA-SE rats. Western blot analysis demonstrated that NRSF levels were still significantly elevated at one week (p<0.05) after the insult, Sham 1.96 ± 0.18, n=3; KA+72h 6.75 ± 0.54, n=3; KA+1w 5.42 ± 0.36, n=3. (D). Augmented binding of an antiserum directed against the dimethylated form of histone 3 (at lysine 9), a general indicator of epigenetic gene repression. Chromatin immunoprecipitation demonstrates selective augmentation of dimethylated H3K9 in the NRSE-containing regulatory region of the hcn1 gene (p<0.05), but not in a non-seizure regulated gene (HCN2) or a non-NRSF-regulated gene (Kv4.2) (normalized values, HCN1: Sham 100 ± 5, n=6; KA+72h 152 ± 21, n=3; KA+1w 133 ± 15, n=3; HCN2: Sham 100 ± 6, n=6; KA+72h 95 ± 9, n=3; KA+1w 93 ± 4, n=3; Kv4.2: Sham 100 ± 8, n=6; KA+72h 109 ± 9, n=3; KA+1w 90 ± 4, n=3). (E) Downregulation of Kv4.2 is NRSF-independent in experimental TLE. KA treatment resulted in a large decrease of Kv4.2 protein levels in the presence of both NRSE and scrambled ODNs (normalized values, SHAM+NRSE 1.00 ± 0.19, n=2; KA+NRSE 0.07 ± 0.05, n=2, p<0.05; SHAM+SCRLD 1.00 ± 0.16, n=2; KA+SCRLD 0.08 ± 0.01, n=2, p<0.05). (F) The amplitude of back-propagating action potentials (bAPs) was still increased in KA+NRSE and KA+SCRLD treated rats. Left panel. Typical examples of bAPs recorded in CA1 pyramidal cell dendrites in a Sham (290 μm from the soma, black trace), a KA+NRSE treated (340 μm from the soma, red trace), and a KA+SCRLD (320 μm from the soma, green trace) animal. Note that bAPs have much larger amplitude in KA treated animals. Right panel. Summary of bAPs amplitude measured in Sham (15.1 ± 1.9 mV, n=8), KA+NRSE (40.2 ± 3.9 mV, n=5) and KA+SCRLD (38.7 ± 4.5 mV, n=5) animals. All recordings were performed at the same distance (around 300 μm) from the soma. * P<0.05.
Fig 6
Fig 6
Preventing the interaction of NRSF with target genes alters the outcome of KA-SE. (A) Example of a spontaneous seizure recorded in an animal treated with NRSE-ODN (top trace). The bottom trace shows an expansion of the seizure. (B) Example of a burst of interictal spikes (top trace) recorded in the same animals as in (A). Note the difference in time scale between the burst of interictal spikes, which lasts roughly 30 min as compared to the seizure, which lasts around 35 s. The bottom trace shows an expansion of the burst of interictal spikes using the same time scale as the expanded portion of the seizure. Interictal activity occurred within a background of theta rhythm. (C) NRSE-ODN treatment (n=5) significantly reduced the mean number of seizures per day (top panel, 2.7 ± 0.8) and the total number of seizures over the 14 day-long continuous recording period, (bottom panel, 25 ± 2) as compared to SCRLD-ODN treatment (n=5, 5.2 ± 0.5 and 82 ± 2, respectively). (D) Cumulative number of seizures recorded in NRSE-ODN and SCRLD-ODN animals. Note the slow evolution in NRSE-ODN animals. (E) NRSE-ODN reduced the number of interictal bursts (NRSE, 1.8 ± 1.5; SCRLD, 22.7 ± 11.7) and the cumulative time spent in interictal activity (NRSE, 26 ± 24 min; SCRLD, 244 ± 92 min). (F) KA-induced seizures resulted in a progressive decline of theta rhythm power in the EEGs, as found in KA animals treated with scrambled ODN. This decline was prevented by NRSE-ODN treatment (there was no difference between the pre KA values and the post KA values). (single asterisk, P < 0.01; triple asterisks P < 0.05).

Similar articles

Cited by

References

    1. Pitkanen A, Kharatishvili I, Karhunen H, et al. Epileptogenesis in experimental models. Epilepsia. 2007;48(Suppl 2):13–20. - PubMed
    1. Dube CM, Brewster AL, Richichi C, et al. Fever, febrile seizures and epilepsy. Trends Neurosci. 2007;30:490–496. - PMC - PubMed
    1. Lukasiuk K, Kontula L, Pitkanen A. cDNA profiling of epileptogenesis in the rat brain. Eur J Neurosci. 2003;17:271–279. - PubMed
    1. Noebels JL. The biology of epilepsy genes. Annu Rev Neurosci. 2003;26:599–625. - PubMed
    1. Beck H, Yaari Y. Plasticity of intrinsic neuronal properties in CNS disorders. Nat Rev Neurosci. 2008;9:357–369. - PubMed

Publication types

MeSH terms

Substances