

A comparative physical map reveals the pattern of chromosomal evolution between the turkey (Meleagris gallopavo) and chicken (Gallus gallus) genomes
- PMID: 21906286
- PMCID: PMC3189400
- DOI: 10.1186/1471-2164-12-447
A comparative physical map reveals the pattern of chromosomal evolution between the turkey (Meleagris gallopavo) and chicken (Gallus gallus) genomes
Abstract
Background: A robust bacterial artificial chromosome (BAC)-based physical map is essential for many aspects of genomics research, including an understanding of chromosome evolution, high-resolution genome mapping, marker-assisted breeding, positional cloning of genes, and quantitative trait analysis. To facilitate turkey genetics research and better understand avian genome evolution, a BAC-based integrated physical, genetic, and comparative map was developed for this important agricultural species.
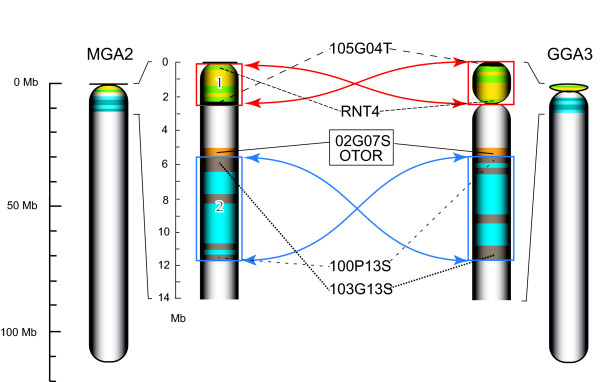
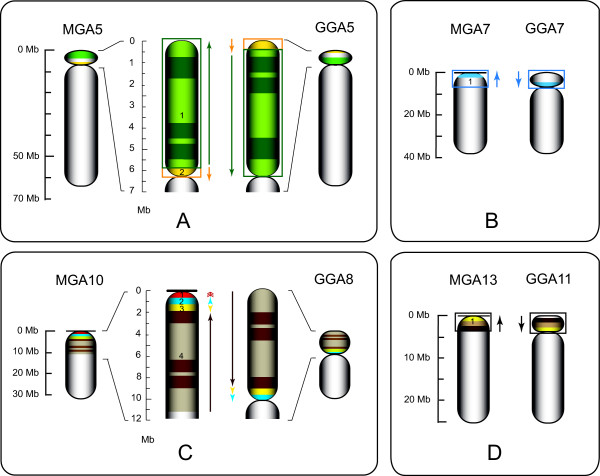
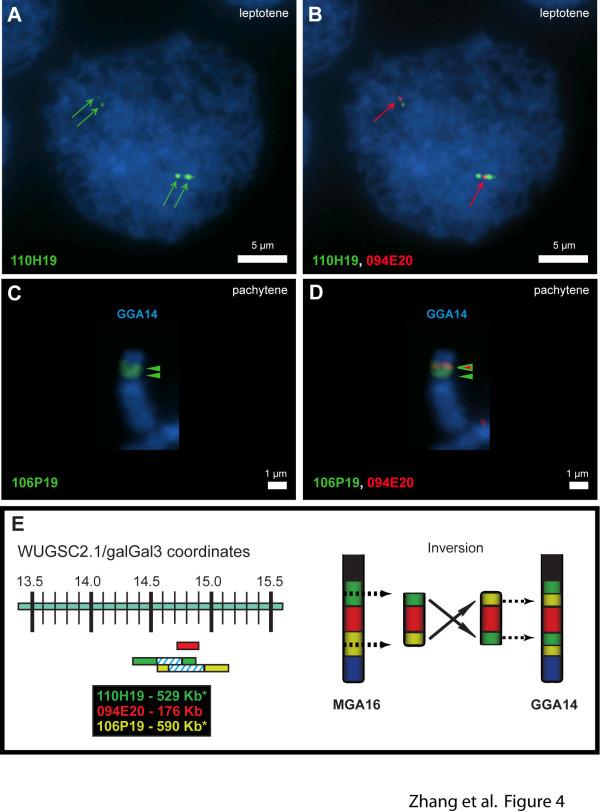
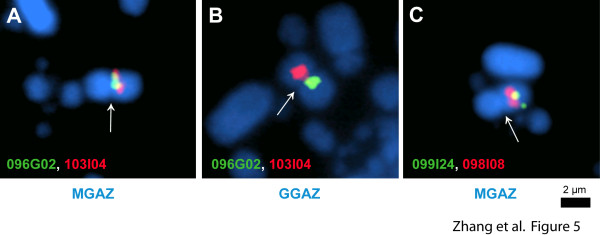
Results: The turkey genome physical map was constructed based on 74,013 BAC fingerprints (11.9 × coverage) from two independent libraries, and it was integrated with the turkey genetic map and chicken genome sequence using over 41,400 BAC assignments identified by 3,499 overgo hybridization probes along with > 43,000 BAC end sequences. The physical-comparative map consists of 74 BAC contigs, with an average contig size of 13.6 Mb. All but four of the turkey chromosomes were spanned on this map by three or fewer contigs, with 14 chromosomes spanned by a single contig and nine chromosomes spanned by two contigs. This map predicts 20 to 27 major rearrangements distinguishing turkey and chicken chromosomes, despite up to 40 million years of separate evolution between the two species. These data elucidate the chromosomal evolutionary pattern within the Phasianidae that led to the modern turkey and chicken karyotypes. The predominant rearrangement mode involves intra-chromosomal inversions, and there is a clear bias for these to result in centromere locations at or near telomeres in turkey chromosomes, in comparison to interstitial centromeres in the orthologous chicken chromosomes.
Conclusion: The BAC-based turkey-chicken comparative map provides novel insights into the evolution of avian genomes, a framework for assembly of turkey whole genome shotgun sequencing data, and tools for enhanced genetic improvement of these important agricultural and model species.
Figures
Similar articles
-
A BAC-based physical map of the chicken genome.Genome Res. 2003 Dec;13(12):2754-8. doi: 10.1101/gr.1499303. Genome Res. 2003. PMID: 14656976 Free PMC article.
-
A SNP based linkage map of the turkey genome reveals multiple intrachromosomal rearrangements between the turkey and chicken genomes.BMC Genomics. 2010 Nov 20;11:647. doi: 10.1186/1471-2164-11-647. BMC Genomics. 2010. PMID: 21092123 Free PMC article.
-
Genomic tools development for Aquilegia: construction of a BAC-based physical map.BMC Genomics. 2010 Nov 8;11:621. doi: 10.1186/1471-2164-11-621. BMC Genomics. 2010. PMID: 21059242 Free PMC article.
-
Genetic, physical, and comparative map of the subtelomeric region of mouse Chromosome 4.Mamm Genome. 2002 Jan;13(1):5-19. doi: 10.1007/s0033501-2109-8. Mamm Genome. 2002. PMID: 11773963 Free PMC article. Review.
-
Insights into avian molecular cytogenetics-with reptilian comparisons.Mol Cytogenet. 2024 Oct 31;17(1):24. doi: 10.1186/s13039-024-00696-y. Mol Cytogenet. 2024. PMID: 39482771 Free PMC article. Review.
Cited by
-
Construction of BIBAC and BAC libraries from a variety of organisms for advanced genomics research.Nat Protoc. 2012 Feb 16;7(3):479-99. doi: 10.1038/nprot.2011.456. Nat Protoc. 2012. PMID: 22343430
-
Comparative cytogenomics of poultry: mapping of single gene and repeat loci in the Japanese quail (Coturnix japonica).Chromosome Res. 2014 Apr;22(1):71-83. doi: 10.1007/s10577-014-9411-2. Chromosome Res. 2014. PMID: 24604153
-
Global genomic diversity of Oryza sativa varieties revealed by comparative physical mapping.Genetics. 2014 Apr;196(4):937-49. doi: 10.1534/genetics.113.159970. Epub 2014 Jan 14. Genetics. 2014. PMID: 24424778 Free PMC article.
-
Centromere positions in chicken and Japanese quail chromosomes: de novo centromere formation versus pericentric inversions.Chromosome Res. 2012 Dec;20(8):1017-32. doi: 10.1007/s10577-012-9319-7. Chromosome Res. 2012. PMID: 23143647
-
Preparation of megabase-sized DNA from a variety of organisms using the nuclei method for advanced genomics research.Nat Protoc. 2012 Feb 16;7(3):467-78. doi: 10.1038/nprot.2011.455. Nat Protoc. 2012. PMID: 22343429
References
-
- FAO. FAOSTAT: Production Database. http://faostat.fao.org/
-
- Shibusawa M, Nishibori M, Nishida-Umehara C, Tsudzuki M, Masabanda J, Griffin DK, Matsuda Y. Karyotypic evolution in the Galliformes: An examination of the process of karyotypic evolution by comparison of the molecular cytogenetic findings with the molecular phylogeny. Cytogenet Genome Res. 2004;106:111–119. doi: 10.1159/000078570. - DOI - PubMed
Publication types
MeSH terms
LinkOut - more resources
Full Text Sources
Miscellaneous
