. 2011 Nov;179(5):2454-63.
doi: 10.1016/j.ajpath.2011.07.014. Epub 2011 Sep 7.

Melanocortin 4 receptor-deficient mice as a novel mouse model of nonalcoholic steatohepatitis

Affiliations

Melanocortin 4 receptor-deficient mice as a novel mouse model of nonalcoholic steatohepatitis

Michiko Itoh et al. Am J Pathol. 2011 Nov.

Abstract

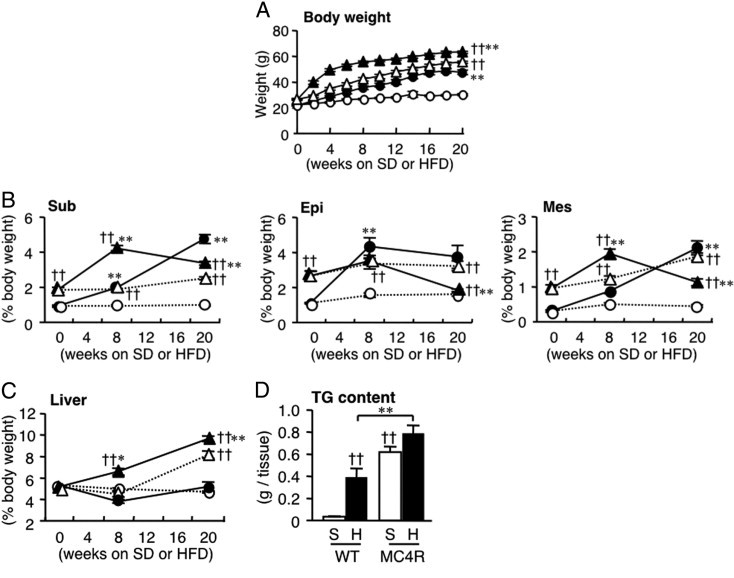
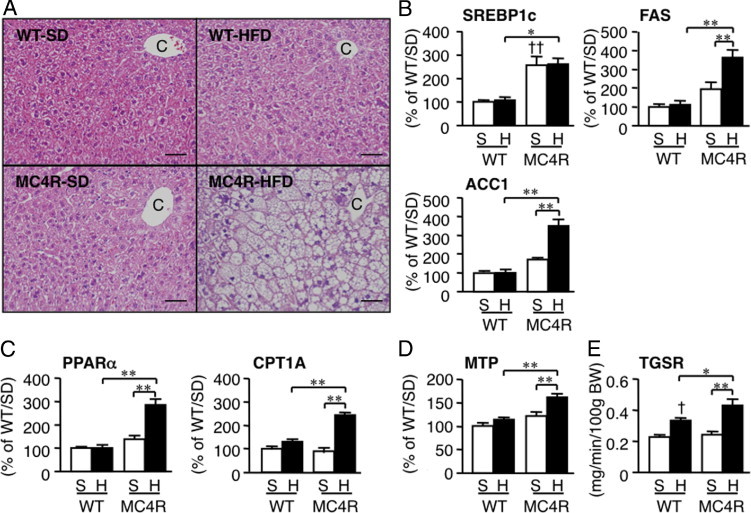
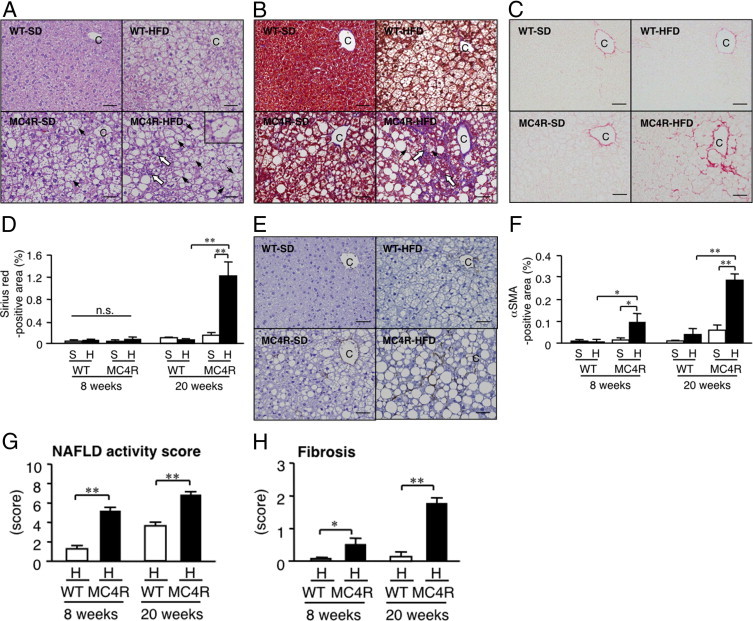
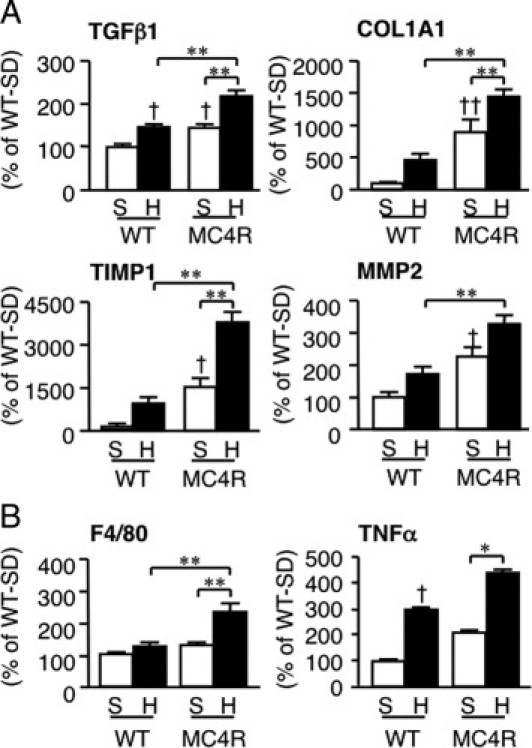
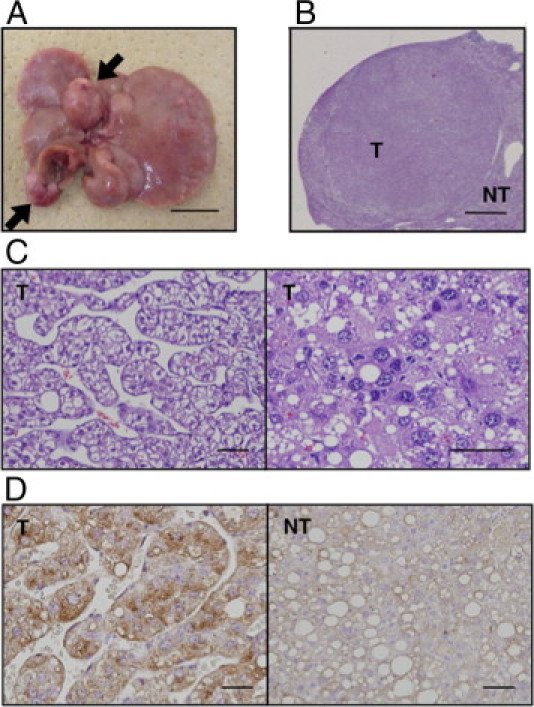
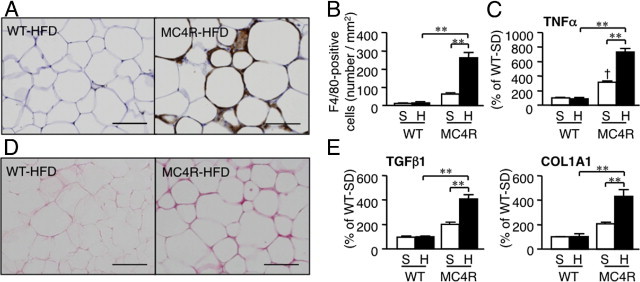
Obesity may be viewed as a state of chronic low-grade inflammation that participates in the development of the metabolic syndrome. Nonalcoholic steatohepatitis (NASH) is considered a hepatic phenotype of the metabolic syndrome and a high risk for progression to cirrhosis and hepatocellular carcinoma. Although the "two hit" hypothesis suggests involvement of excessive hepatic lipid accumulation and chronic inflammation, the molecular mechanisms underlying the development of NASH remain unclear, in part because of lack of appropriate animal models. Herein we report that melanocortin 4 receptor-deficient mice (MC4R-KO) develop steatohepatitis when fed a high-fat diet, which is associated with obesity, insulin resistance, and dyslipidemia. Histologic analysis reveals inflammatory cell infiltration, hepatocyte ballooning, and pericellular fibrosis in the liver in MC4R-KO mice. Of note, all of the MC4R-KO mice examined developed well-differentiated hepatocellular carcinoma after being fed a high-fat diet for 1 year. They also demonstrated enhanced adipose tissue inflammation, ie, increased macrophage infiltration and fibrotic changes, which may contribute to excessive lipid accumulation and enhanced fibrosis in the liver. Thus, MC4R-KO mice provide a novel mouse model of NASH with which to investigate the sequence of events that make up diet-induced hepatic steatosis, liver fibrosis, and hepatocellular carcinoma and to aid in understanding the pathogenesis of NASH, pursuing specific biomarkers, and evaluating potential therapeutic strategies.


Figures

Figure 1
Figure 1
Body and tissue weights in MC4R-KO mice during HFD feeding for 20 weeks. Growth curve (A) and weights of the subcutaneous (Sub), epididymal (Epi), and mesenteric (Mes) white adipose tissue (B) and liver (C) in male MC4R-KO (MC4R) and wild-type (WT) mice fed either the standard diet (SD or S) or the high-fat diet (HFD or H). Open circle, WT-S; closed circle, WT-H; open triangle, MC4R-S; closed triangle, MC4R-H. ††P < 0.01 versus diet-matched control; *P < 0.05; **P < 0.01 versus genotype-matched control. D: Liver TG content at 20 weeks. ††P < 0.01 versus WT-S; **P < 0.01. WT and MC4R, n = 8 at 0 week; WT-S and WT-H, n = 5; MC4R-S, n = 5; MC4R-H, n = 6 at 8 weeks; WT-S, n = 8; WT-H, n = 7; MC4R-S, n = 8; MC4R-H, n = 10 at 20 weeks.
Figure 2
Figure 2
Hepatic histologic features and mRNA expression of genes related to lipid metabolism in MC4R-KO and WT mice fed the HFD for 8 weeks. A: H&E staining of the liver. C, central vein. Original magnification, × 200. Scale bar = 50 μm. Hepatic mRNA expression of genes for de novo lipogenesis (sterol regulatory element binding protein 1c, fatty acid synthase, and acetyl-CoA carboxylase 1) (B), oxidative metabolism (peroxisome proliferator-activated receptor-α and carnitine palmitoyltransferase 1A) (C), and TG secretion (microsomal TG transport protein) (D). E: Triglyceride secretion rate from the liver at 2 weeks of HFD feeding. *P < 0.05; **P < 0.01; P < 0.05; ††P < 0.01 versus WT-S. WT-S and WT-H, n = 5; MC4R-S, n = 5; MC4R-H, n = 6.
Figure 3
Figure 3
Histologic analysis of liver from MC4R-KO mice fed the HFD for 20 weeks. A: H&E staining of liver sections from MC4R-KO and WT mice after 20 weeks of HFD feeding. Inset: Representative image of hepatocyte ballooning (arrowhead). Fibrillar collagen deposition evaluated using Masson's trichrome staining (B) and Sirius red staining (C) at 20 weeks. D: Quantification of area positive for Sirius red at 8 and 20 weeks. E: Activated hepatic stellate cells determined at α-SMA immunostaining at 20 weeks. F: Quantification of area positive for α-SMA area at 8 and 20 weeks. NAFLD activity (G) and fibrosis (H) scores. Original magnification, × 200. Scale bar = 50 μm. C, central vein; P, portal vein; white arrow, infiltrated inflammatory cells. *P < 0.05; **P < 0.01; n.s., not significant. WT-S and WT-H, n = 5; MC4R-S, n = 5; MC4R-H, n = 6 at 8 weeks. WT-S, n = 8; WT-H, n = 7; MC4R-S, n = 8; and MC4R-H, n = 10 at 20 weeks.
Figure 4
Figure 4
Hepatic mRNA expression in MC4R-KO mice fed the HFD for 20 weeks. Hepatic mRNA expression levels were measured using quantitative PCR after 20 weeks of HFD feeding. mRNA expression of fibrogenic factors (transforming growth factor-β1; collagen, type 1, α1; tissue inhibitor of metalloproteinase 1;, and metalloproteinase 2) (A) and inflammatory markers (F4/80 and tumor necrosis factor-α) (B). *P < 0.05; **P < 0.01; P < 0.05; ††P < 0.01 versus WT-S. WT-S, n = 8; WT-H, n = 7; MC4R-S, n = 8; and MC4R-H, n = 10.
Figure 5
Figure 5
Development of hepatocellular carcinoma in liver from MC4R-KO mice after 1 year of HFD feeding. All MC4R-KO mice (n = 5) developed multiple liver tumors (arrows). A: Representative macroscopic image of liver from MC4R-KO mice. H&E staining (B and C) and α-fetoprotein immunostaining (D) of the tumor. NT, non-tumor liver; T, tumors. Scale bars: 1 cm (A); 1 mm (B); 50 μm (C and D).
Figure 6
Figure 6
Inflammatory changes in epididymal white adipose tissue from MC4R-KO mice fed the HFD. Representative F4/80 immunostaining (A) and quantification of F4/80-positive cells (B) of the epididymal white adipose tissue from MC4R-KO and WT mice fed the HFD for 8 weeks. Original magnification, ×200. Scale bar = 100 μm. C: Tumor necrosis factor-α mRNA expression in the epididymal white adipose tissue. Sirius red staining of epididymal white adipose tissue (D) and mRNA expression of fibrogenic genes (transforming growth factor-β1; and collagen, type 1, α1) (E). **P < 0.01; P < 0.05 versus WT-S. WT-S and WT-H, n = 5; and MC4R-S, n = 5, MC4R-H, n = 6.

References

    1. Neuschwander-Tetri B.A., Caldwell S.H. Nonalcoholic steatohepatitis: summary of an AASLD single topic conference. Hepatology. 2003;37:1202–1219. - PubMed
    1. Marchesini G., Bugianesi E., Forlani G., Cerrelli F., Lenzi M., Manini R., Natale S., Vanni E., Villanova N., Melchionda N., Rizzetto M. Nonalcoholic fatty liver, steatohepatitis, and the metabolic syndrome. Hepatology. 2003;37:917–923. - PubMed
    1. Varela-Rey M., Embade N., Ariz U., Lu S.C., Mato J.M., Martinez-Chantar M.L. Non-alcoholic steatohepatitis and animal models: understanding the human disease. Int J Biochem Cell Biol. 2009;41:969–976. - PubMed
    1. Day C.P., James O.F. Steatohepatitis: a tale of two “hits”? Gastroenterology. 1998;114:842–845. - PubMed
    1. Browning J.D., Horton J.D. Molecular mediators of hepatic steatosis and liver injury. J Clin Invest. 2004;114:147–152. - PMC - PubMed

Publication types