. 2011 Sep 7;14(3):301-12.
doi: 10.1016/j.cmet.2011.06.014.

SIRT1 deacetylase in SF1 neurons protects against metabolic imbalance

Affiliations

SIRT1 deacetylase in SF1 neurons protects against metabolic imbalance

Giorgio Ramadori et al. Cell Metab. .

Abstract

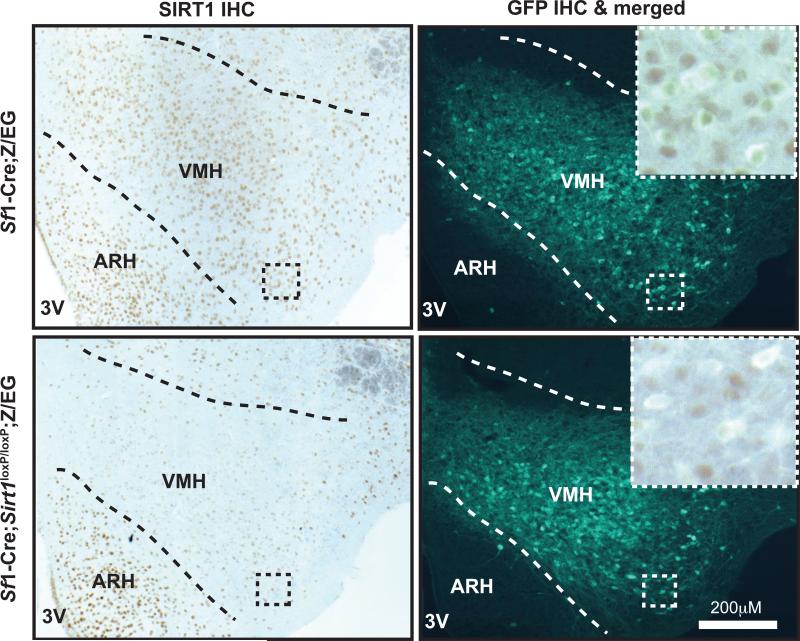
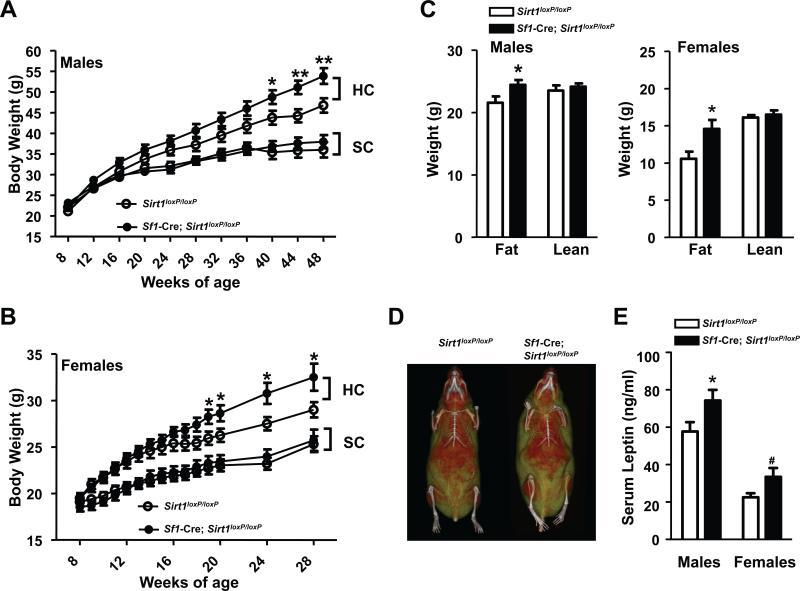
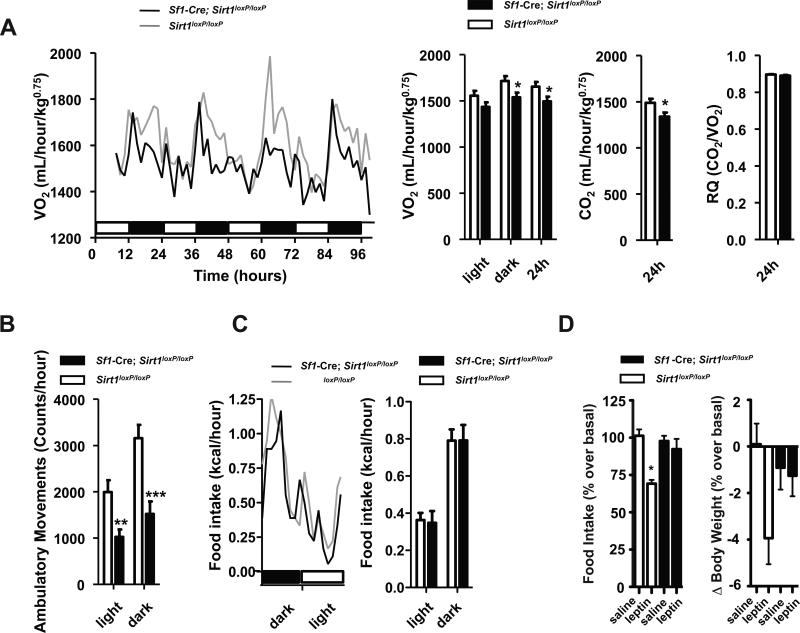
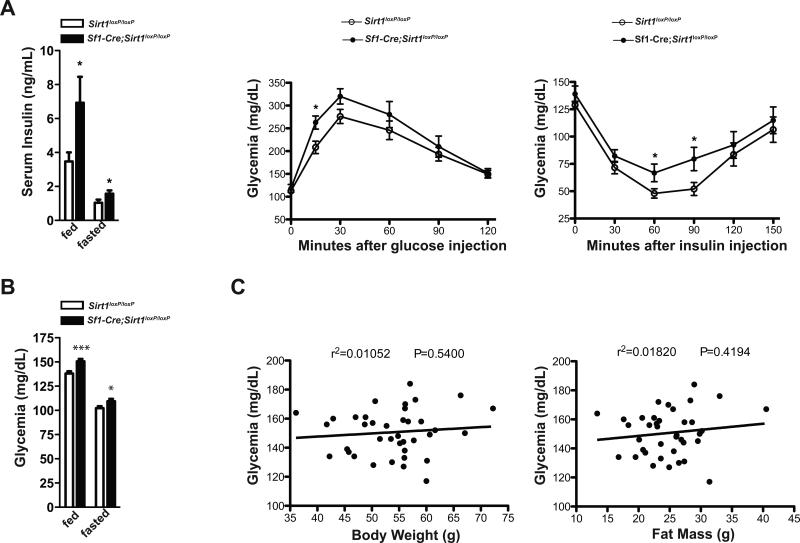
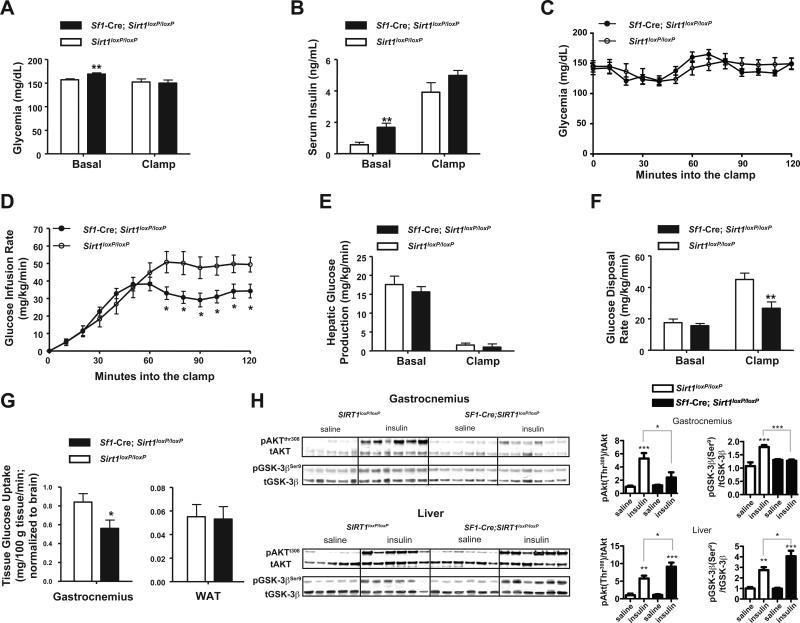
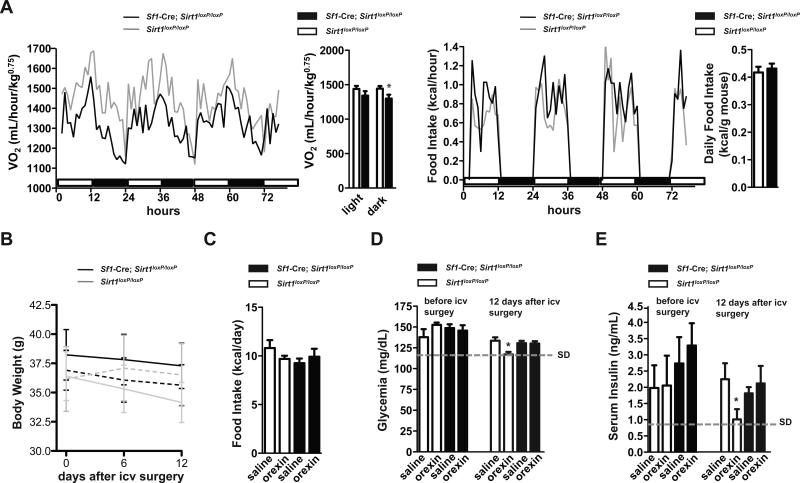
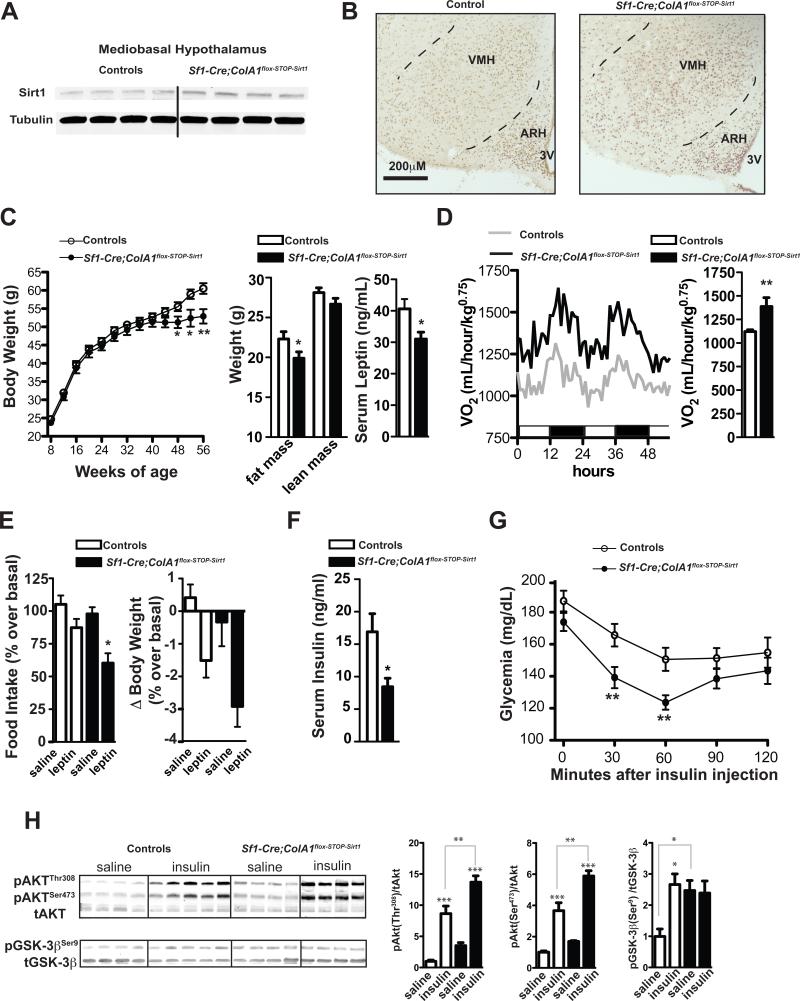
Chronic feeding on high-calorie diets causes obesity and type 2 diabetes mellitus (T2DM), illnesses that affect hundreds of millions. Thus, understanding the pathways protecting against diet-induced metabolic imbalance is of paramount medical importance. Here, we show that mice lacking SIRT1 in steroidogenic factor 1 (SF1) neurons are hypersensitive to dietary obesity owing to maladaptive energy expenditure. Also, mutant mice have increased susceptibility to developing dietary T2DM due to insulin resistance in skeletal muscle. Mechanistically, these aberrations arise, in part, from impaired metabolic actions of the neuropeptide orexin-A and the hormone leptin. Conversely, mice overexpressing SIRT1 in SF1 neurons are more resistant to diet-induced obesity and insulin resistance due to increased energy expenditure and enhanced skeletal muscle insulin sensitivity. Our results unveil important protective roles of SIRT1 in SF1 neurons against dietary metabolic imbalance.


Figures

Figure 1
Figure 1. Deletion of SIRT1 is restricted to SF1 neurons
Representative photomicrographs of brain slices from Sirt1loxP/loxP;Z/EG (control) or Sf1-Cre; Sirt1loxP/loxP;Z/EG mice stained for SIRT1 and GFP. The Z/EG allele was introduced to allow the expression of GFP selectively in SF1 neurons, as previously described (Dhillon et al., 2006). Dark-brown staining and green fluorescence represent SIRT1 and GFP immunoreactivity, respectively. Higher magnification of the boxed region is in the top left corner of the photomicrograph. Note that while almost all SF1 neurons express SIRT1 in control brains (530 out of 546 SF1 neurons were found to be SIRT1-positive) very few express SIRT1 in Sf1-Cre; Sirt1loxP/loxP; Z/EG mice (52 out of 576 SF1 neurons were found to be SIRT1-positive). Abbreviations: third ventricle (3V); hypothalamic arcuate (ARH) and ventromedial (VMH) nuclei; immunohistochemistry (IHC). Dashed lines indicate VMH boundaries. See also Figure S1.
Figure 2
Figure 2. SIRT1 in SF1 neurons is required for normal defenses against diet-induced obesity in male and female mice
(A) Body weight curves of standard chow (SC)-fed Sirt1loxP/loxP (n=21) and Sf1-Cre, Sirt1loxP/loxP (n=21) males, high-calorie (HC)-fed Sirt1loxP/loxP (n=16) and Sf1-Cre, Sirt1loxP/loxP (n=24) males, (B) SC-fed Sirt1loxP/loxP (n=16) and Sf1-Cre, Sirt1loxP/loxP (n=13) females, HC-fed Sirt1loxP/loxP (n=14) and Sf1-Cre,Sirt1loxP/loxP (n=14) females. (C) Body composition, (D) representative micro-computed tomography images, and (E) serum leptin levels of Sirt1loxP/loxP and Sf1-Cre, Sirt1loxP/loxP mice; data shown in C, D, and E were gathered from 28-week-old females and 48-week-old males (n=13-17). In (D) red and yellow/green colors represent lean and fat mass, respectively; females are shown. Error bars represent s.e.m. Statistical analyses were done using two-tailed unpaired Student's t test. #P=0.05; *P<0.05; **P<0.01; #P=0.05. See also Table S1.
Figure 3
Figure 3. Normophagia, reduced energy expenditure, and leptin resistance in mice lacking SIRT1 in SF1 neurons
(A) O2 consumption, CO2 and heat production, respiratory quotient (RQ), (B) ambulatory movements, and (C) food intake were measured before body weight diverged in 16-week-old Sirt1loxP/loxP and Sf1-Cre, Sirt1loxP/loxP females fed on a high-calorie (HC) diet for 8 weeks (n=12). Data were collected using the Columbus Instruments Comprehensive Lab Animal Monitoring System (CLAMS). Time 0 represents the beginning of the dark cycle in a 12-hour dark/light cycle environment. Black and white boxes represent dark and light cycles, respectively. (D) Food intake and body weight difference following 2 days of intraperitoneal injections of leptin (daily dose = 3g of leptin/kg) or saline in 16-week-old Sirt1loxP/loxP and Sf1-Cre, Sirt1loxP/loxP HC-fed females (n=6). Error bars represent s.e.m. Statistical analyses were done using two-tailed unpaired Student's t test and one-way ANOVA (Tukey's post test) . *P<0.05, **P<0.01, ***P<0.01. See also Figure S2.
Figure 4
Figure 4. Loss of SIRT1 in SF1 neurons causes impaired glucose/insulin homeostasis in a body-adiposity-independent manner
(A) Serum insulin level after 3 hours of food removal (fed values) or 14 hours of fasting (fasted values), glucose tolerance test (GTT) and insulin tolerance test (ITT) in 28-week-old Sirt1loxP/loxP (n=12) and Sf1-Cre, Sirt1loxP/loxP (n= 17) males fed on a high-calorie (HC) diet. (B) Glycemia after 3 hours of food removal (fed values) or 14 hours of fasting (fasted values), GTT and ITT in 48-week-old Sirt1loxP/loxP (n=34) and Sf1-Cre, Sirt1loxP/loxP (n=38) males fed on a HC diet. HC-fed mice were fed on a SC diet up to 8 weeks of age and then switched and maintained on a HC diet. (C) Correlation between glycemia and fat mass or body weight. GTT: dose of glucose injected intraperitoneally/mouse weight = 1g/kg. ITT: dose of insulin injected intraperitoneally/mouse weight = 1.25U/kg and 0.75U/kg in males and females, respectively. Error bars represent s.e.m. Statistical analyses were done using two-tailed unpaired Student's t test. Correlation analyses were performed by using the Spearman rank-correlation test. *P<0.05, ***P<0.001. See also Figure S3.
Figure 5
Figure 5. Loss of SIRT1 in SF1 neurons causes insulin resistance in skeletal muscle
(A-G) Euglycemic-hyperinsulinemic clamps were preformed in Sirt1loxP/loxP (n=9) and Sf1-Cre, Sirt1loxP/loxP (n=8) 28-week old conscious males that have been fed on a high-calorie (HC) diet for 20 weeks. Mice were surgically implanted with a right jugular vein catheter 5-7 days prior to study. Mice were fasted for 4 hours and blood samples were obtained from tail vein. 2 weeks prior to the clamp assay body weight was undistinguishable between mutants and controls. At the time clamps were performed,Sf1-Cre, Sirt1loxP/loxP mice displayed a slight increase in body weight compared to controls (P=0.04). (A) Basal and clamp glycemia and (B) serum insulin levels. (C) Glycemia and (D) glucose infusion rate during the clamp. (E) Basal and clamp hepatic glucose production and (F), glucose disposal rate. (G) Tissue-specific insulin stimulated glucose uptake. (H) Immunoblot and quantification of Akt (Thr308) and GSK-3β (Ser9) phosphorylation status relative to total AKT (tAKT) or total GSK-3β (tGSK-3β) in gastrocnemius muscle and liver 20 minutes after an intraperitoneal bolus of insulin (3U/kg) or saline in Sirt1loxP/loxP and Sf1-Cre, Sirt1loxP/loxP standard chow (SC)-fed 28-week old males (n=5-6 per group). Error bars represent s.e.m. Statistical analyses were done using two-tailed unpaired Student's t test and one-way ANOVA (Tukey's post test). *P <0.05; **P <0.01; ***P <0.001. In (H) P values are saline- vs. insulin-treated mice of the same genotype, unless otherwise indicated. See also Figure S4.
Figure 6
Figure 6. SIRT1 in SF1 neurons is required for the normal metabolic actions of Orexin-A
(A) O2 consumption and food intake were measured in Sirt1loxP/loxP (n=12) and Sf1-Cre, Sirt1loxP/loxP (n=12) HC-fed 17-week old females after they were maintained for 3 weeks in a lights-on restricted feeding regimen. Data were collected using the Columbus Instruments Comprehensive Lab Animal Monitoring System (CLAMS). Time 0 represents 6 hours after the beginning of the light cycle in a 12-hour dark/light cycles environment. HC-fed mice were fed on a SC diet up to 8 weeks of age and then switched and maintained on a HC diet. (B) Body weight and (C) daily average of food intake of Sirt1loxP/loxP and Sf1-Cre, Sirt1loxP/loxP 20-week old HC-fed males 12 days into icv delivery of either placebo (n=7-8 each genotype; dashed lines) or orexin-A (n=7 each genotype; solid lines). (D) Glycemia and (E) serum insulin were assessed before and after 12 days of treatment. In (D) and (E) dashed lines represent average glycemia and serum insulin levels in age-matched standard diet (SD)-fed Sirt1loxP/loxP males, respectively. Error bars represent s.e.m. Statistical analyses were done using two-tailed unpaired Student's t test or using one-way ANOVA (Tukey's post test).*P<0.05. See also Figure S6.
Figure 7
Figure 7. SIRT1 overexpression in SF1 neurons protects against diet-induced obesity and glucose/insulin imbalance
(A) SIRT1 and α-tubulin (used as loading control) protein levels were assessed by immunoblot in hypothalamus of Sf1-Cre; ColA1flox-STOP-Sirt1 mice or controls. (B) Representative photomicrographs of brain slices from control or Sf1-Cre; ColA1flox-STOP-Sirt1 mice stained for SIRT1 (dark-brown staining represents SIRT1 immunoreactivity). (C) Body weight curves, body composition, and serum leptin level and (D) oxygen consumption of high-calorie (HC)-fed Sf1-Cre; ColA1flox-STOP-Sirt1 males (n=12) and controls (n=25). Body composition and serum leptin contents were measured in 48-week-old mice. (E) Food intake and body weight difference following 2 days of intraperitoneal injections of leptin (daily dose = 3g of leptin/kg) or saline in 52-week-old HC-fed Sf1-Cre; ColA1flox-STOP-Sirt1 and control males (n=5). (F) Serum insulin level after 3 hours of food removal, (G) insulin tolerance test (ITT) in 48-week-old HC-fed Sf1-Cre; ColA1flox-STOP-Sirt1 (n=12) and control mice (n=17). ITT: dose of insulin injected intraperitoneally/mouse weight = 1.25U/kg. (H) Immunoblot and quantification of Akt(Ser479), Akt (Thr308) and GSK-3β(Ser9) phosphorylation status relative to total AKT (tAKT) or total GSK-3β (tGSK-3β) in gastrocnemius muscle 10 minutes after an intraperitoneal bolus of insulin (5U/kg) or saline in 14-weeks-old HC-fed Sf1-Cre; ColA1flox-STOP-Sirt1and control mice. Sf1-Cre; ColA1flox-STOP-Sirt1 mice were generated by mating Sf1-Cre and ColA1flox-STOP-Sirt1 mice. This breeding also generated Sf1-Cre and wild-type mice. Because no differences in body weight, food intake, energy expenditure, glycemia, insulinemia, ITT and GTT were noted between Sf1-Cre and wild-type HC-fed mice data from these two groups were pooled together and used as controls. Error bars represent s.e.m. Statistical analyses were done using two-tailed unpaired Student's t test and one-way ANOVA (Tukey's post test). *P<0.05, **P<0.01, ***P<0.001. Abbreviations: third ventricle (3V); hypothalamic arcuate (ARH) and ventromedial (VMH) nuclei. Dashed lines indicate VMH boundaries. In (H) P values are saline- vs. insulin-treated mice of the same genotype, unless otherwise indicated. See also Figure S5.

References

    1. Araki T, Sasaki Y, Milbrandt J. Increased nuclear NAD biosynthesis and SIRT1 activation prevent axonal degeneration. Science (New York, NY. 2004;305:1010–1013. - PubMed
    1. Banks AS, Kon N, Knight C, Matsumoto M, Gutierrez-Juarez R, Rossetti L, Gu W, Accili D. SirT1 gain of function increases energy efficiency and prevents diabetes in mice. Cell Metab. 2008;8:333–341. - PMC - PubMed
    1. Baur JA, Pearson KJ, Price NL, Jamieson HA, Lerin C, Kalra A, Prabhu VV, Allard JS, Lopez-Lluch G, Lewis K, et al. Resveratrol improves health and survival of mice on a high-calorie diet. Nature. 2006;444:337–342. - PMC - PubMed
    1. Beher D, Wu J, Cumine S, Kim KW, Lu SC, Atangan L, Wang M. Resveratrol is not a direct activator of SIRT1 enzyme activity. Chemical biology & drug design. 2009;74:619–624. - PubMed
    1. Bingham NC, Anderson KK, Reuter AL, Stallings NR, Parker KL. Selective loss of leptin receptors in the ventromedial hypothalamic nucleus results in increased adiposity and a metabolic syndrome. Endocrinology. 2008;149:2138–2148. - PMC - PubMed

Publication types

MeSH terms