. 2011 Nov 24:196:251-64.
doi: 10.1016/j.neuroscience.2011.08.016. Epub 2011 Aug 16.

DJ-1 knock-down impairs astrocyte mitochondrial function

Affiliations

DJ-1 knock-down impairs astrocyte mitochondrial function

N J Larsen et al. Neuroscience. .

Abstract

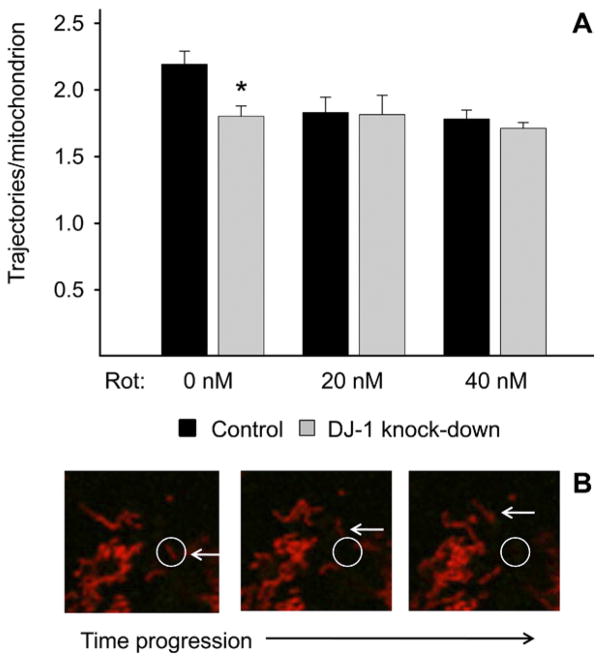
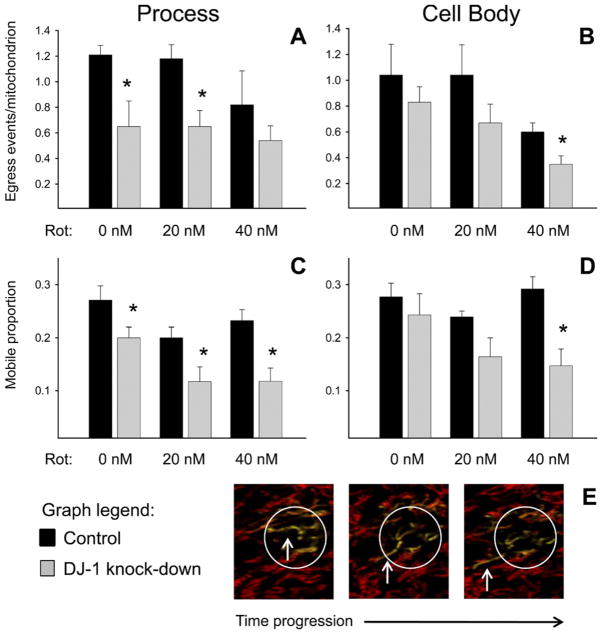
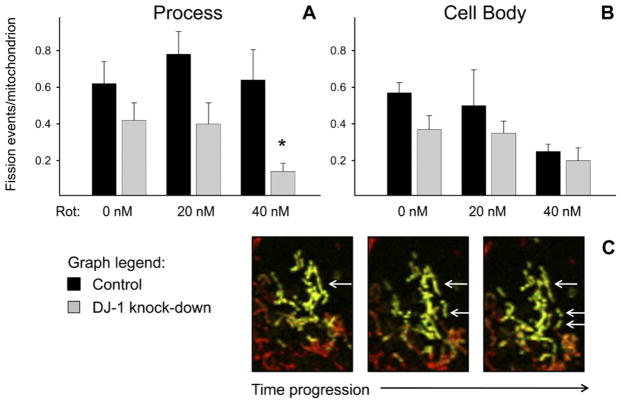
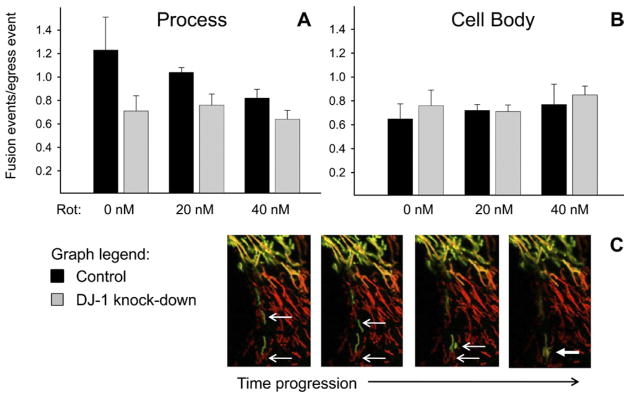
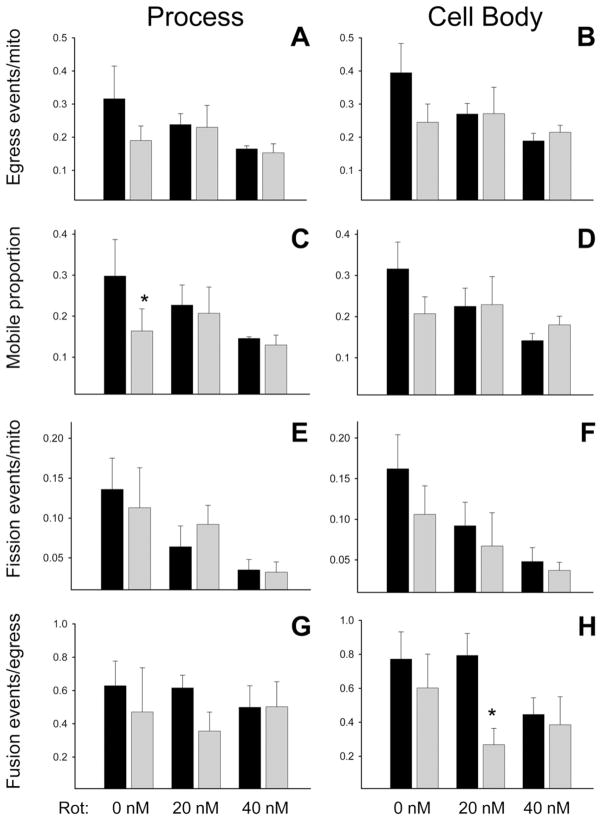
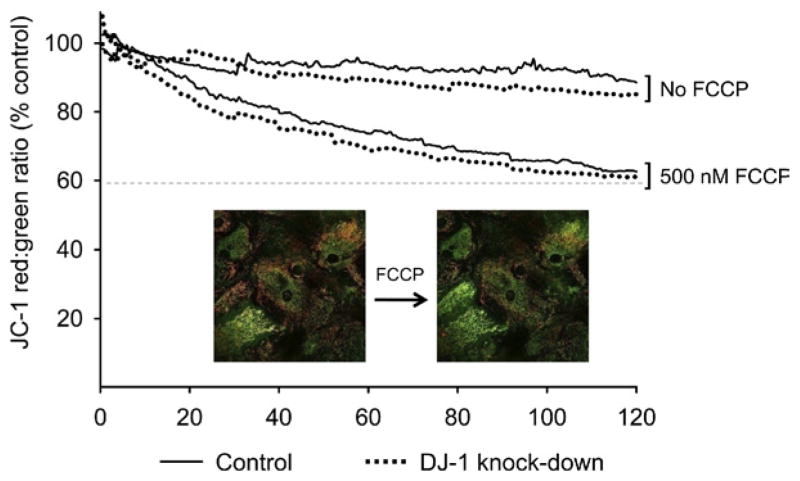
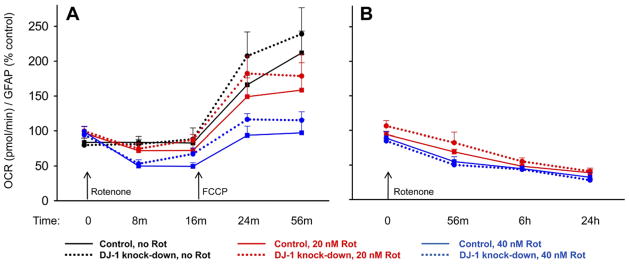
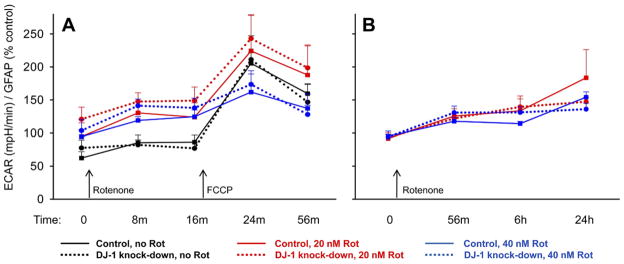
Mitochondrial dysfunction has long been implicated in the pathogenesis of Parkinson's disease (PD). PD brain tissues show evidence for mitochondrial respiratory chain Complex I deficiency. Pharmacological inhibitors of Complex I, such as rotenone, cause experimental parkinsonism. The cytoprotective protein DJ-1, whose deletion is sufficient to cause genetic PD, is also known to have mitochondria-stabilizing properties. We have previously shown that DJ-1 is over-expressed in PD astrocytes, and that DJ-1 deficiency impairs the capacity of astrocytes to protect co-cultured neurons against rotenone. Since DJ-1 modulated, astrocyte-mediated neuroprotection against rotenone may depend upon proper astrocytic mitochondrial functioning, we hypothesized that DJ-1 deficiency would impair astrocyte mitochondrial motility, fission/fusion dynamics, membrane potential maintenance, and respiration, both at baseline and as an enhancement of rotenone-induced mitochondrial dysfunction. In astrocyte-enriched cultures, we observed that DJ-1 knock-down reduced mitochondrial motility primarily in the cellular processes of both untreated and rotenone treated cells. In these same cultures, DJ-1 knock-down did not appreciably affect mitochondrial fission, fusion, or respiration, but did enhance rotenone-induced reductions in the mitochondrial membrane potential. In neuron-astrocyte co-cultures, astrocytic DJ-1 knock-down reduced astrocyte process mitochondrial motility in untreated cells, but this effect was not maintained in the presence of rotenone. In the same co-cultures, astrocytic DJ-1 knock-down significantly reduced mitochondrial fusion in the astrocyte cell bodies, but not the processes, under the same conditions of rotenone treatment in which DJ-1 deficiency is known to impair astrocyte-mediated neuroprotection. Our studies therefore demonstrated the following new findings: (i) DJ-1 deficiency can impair astrocyte mitochondrial physiology at multiple levels, (ii) astrocyte mitochondrial dynamics vary with sub-cellular region, and (iii) the physical presence of neurons can affect astrocyte mitochondrial behavior.


Figures

Fig. 1
Fig. 1
Whole-cell mitochondrial motility was impaired by DJ-1 knockdown in astrocyte-enriched cultures. Control (black bars) and DJ-1 knock-down (gray bars) astrocytes were transfected with mtDsRed2 to identify and track live mitochondria, and then treated for 24 h with 0, 20, or 40 nM rotenone. (A) Untreated DJ-1 knock-down astrocytes exhibited reduced mitochondrial motility (trajectories beyond a radius threshold/mitochondrion) relative to control astrocytes, but rotenone treatments did not augment this effect. Asterisks (*) represent P<0.05 for same-treatment comparisons between control and DJ-1 knockdown astrocytes by paired t-tests. Mean±SE shown, n=6. (B) Sequential photomicrograph frames of a mobile mtDsRed2+ mitochondrion moving beyond a simulated radius threshold. For interpretation of the references to color in this figure legend, the reader is referred to the Web version of this article.
Fig. 2
Fig. 2
DJ-1 knock-down reduced mitochondrial motility predominantly at cellular processes in astrocyte-enriched cultures. Control (black bars) and DJ-1 knock-down (gray bars) astrocytes were co-transfected with mtDsRed2 and mtPAGFP, and then treated for 24 h with 0, 20, or 40 nM rotenone. Mitochondrial egress events (mitochondrial movements across an ROI boundary, (A–B)) and mobile mitochondria (within an ROI, (C–D)) were counted and then normalized to the total number of mitochondria within the same ROI. Asterisks (*) represent P<0.05 for same-treatment comparisons between control and DJ-1 knock-down astrocytes by paired t-tests. Mean±SE shown, n=6. (A) In astrocyte processes, DJ-1 knock-down reduced mitochondrial egress in untreated and 20 nM rotenone treated cells. (B) In astrocyte cell bodies, DJ-1 knock-down caused a trend towards reduced mitochondrial egress that was not significant until the cells were treated with 40 nM rotenone. (C) In astrocyte processes, DJ-1 knock-down reduced the mitochondrial mobile proportion under all conditions of treatment. (D) In astrocyte cell bodies, DJ-1 knock-down caused a trend towards reduced mitochondrial mobile proportion that was not significant until the cells were treated with 40 nM rotenone. (E) Sequential photomicrograph frames of a mobile photoactivated mtPAGFP+ (green fluorescent) mitochondrion that leaves a simulated laser-photoactivated ROI. For interpretation of the references to color in this figure legend, the reader is referred to the Web version of this article.
Fig. 3
Fig. 3
DJ-1 knock-down reduced mitochondrial fission in cellular processes only in the presence of high-dose rotenone in astrocyte-enriched cultures. Control (black bars) and DJ-1 knock-down (gray bars) astrocytes were co-transfected with mtDsRed2 and mtPAGFP, and then treated for 24 h with 0, 20, or 40 nM rotenone. Mitochondrial fission events (fragmentation of mtPAGFP+ mitochondria into separate organelles) were counted and normalized to the total number of mitochondria within the ROI. Asterisks (*) represent P<0.05 for same-treatment comparisons between control and DJ-1 knock-down astrocytes by paired t-tests. Mean±SE shown, n=6. (A) In astrocyte processes, DJ-1 knock-down caused a trend towards reduced mitochondrial fission that was only significant after treatment with 40 nM rotenone. (B) In astrocyte cell bodies, DJ-1 knock-down did not alter mitochondrial fission. (C) Sequential photomicrograph frames of an mtPAGFP+ (green fluorescent) mitochondrion that underwent two fission events within the laser-photoactivated ROI. For interpretation of the references to color in this figure legend, the reader is referred to the Web version of this article.
Fig. 4
Fig. 4
DJ-1 knock-down did not alter mitochondrial fusion in astrocyte-enriched cultures. Control (black bars) and DJ-1 knock-down (gray bars) astrocytes were co-transfected with mtDsRed2 and mtPAGFP, and then treated for 24 h with 0, 20, or 40 nM rotenone. Mitochondrial fusion events (mixing of adjacent organelle mtPAGFP+ and mtDsRed2+ mitochondrial contents) were counted and normalized to the total number of mitochondrial egress events from that ROI. Same-treatment comparisons were made between control and DJ-1 knock-down astrocytes by paired t-tests. Mean±SE shown, n=6. (A) In astrocyte processes, neither DJ-1 knock-down nor rotenone treatment altered mitochondrial fusion. (B) The same was true in astrocyte cell bodies. (C) Sequential photomicrograph frames showing a fusion event between an mtPAGFP+ (green) mitochondrion and an mtDsRed2+ (red) mitochondrion. For interpretation of the references to color in this figure legend, the reader is referred to the Web version of this article.
Fig. 5
Fig. 5
In the presence of contact co-cultured neurons, astrocytic DJ-1 knock-down reduced mitochondrial motility in untreated astrocyte processes and mitochondrial fusion in rotenone-treated astrocyte cell bodies. Control (black bars) and DJ-1 knock-down (gray bars) astrocytes were co-transfected with mtDsRed2 and mtPAGFP, and then treated for 24 h with 0, 20, or 40 nM rotenone. Astrocyte mitochondrial egress events (A–B), mobile proportions (C–D), fission events (E–F), and fusion events (G–H) were calculated in cellular processes (A, C, E, G) and cell bodies (B, D, F, H). Asterisks (*) represent P<0.05 for same-treatment comparisons made between control and DJ-1 knock-down astrocytes by paired t-tests. Mean±SE shown, n=6. (A) In astrocyte processes, DJ-1 knock-down caused a trend towards reduced mitochondrial egress only in untreated cells. (B) In astrocyte cell bodies, a similar pattern was seen. (C) In astrocyte processes, DJ-1 knock-down reduced the mitochondrial mobile proportion only in untreated cells. (D–G) DJ-1 knock-down did not affect the mitochondrial mobile proportion in astrocyte cell bodies (D), mitochondrial fission in astrocyte processes (E) or cell bodies (F), or mitochondrial fusion in astrocyte processes (G). (H) In astrocyte cell bodies, DJ-1 knock-down reduced mitochondrial fusion in cells treated with 20 nM rotenone, but the effect at 40 nM was obscured by a similar reduction in fusion induced by rotenone.
Fig. 6
Fig. 6
DJ-1 knock-down did not alter the baseline ΔΨm or enhance FCCP-induced ΔΨm depolarization in astrocyte-enriched cultures. Astrocytes in the field of view were imaged every 30 s over 2 h to determine the JC-1 red:green emission ratio (times are shown in minutes on the x-axis). A red-to-green shift, or reduced ratio, represented depolarized ΔΨm (see photomicrograph insert). Untreated astrocytes displayed a small reduction in red:green fluorescence as a function of time, but there was no significant difference between control (solid lines) and DJ-1 knock-down (dashed lines) cells. 500 nM FCCP reduced the red:green ratio more robustly, but there was again no significant difference in ΔΨm between the control and DJ-1 knockdown astrocytes. Maximal ΔΨm depolarization occurred by ~90 m (the 60% asymptote line). For interpretation of the references to color in this figure legend, the reader is referred to the Web version of this article.
Fig. 7
Fig. 7
DJ-1 knock-down enhanced rotenone-induced ΔΨm depolarization in astrocyte-enriched cultures. Control (solid lines) and DJ-1 knock-down (dashed lines) astrocytes were treated with 20 or 40 nM rotenone and imaged every 30 s for 2 h using a confocal microscope to determine the JC-1 dye red:green emission ratio (times are shown in minutes on the x-axis). An emission shift from red to green (reduced ratio) represented a depolarization in ΔΨm. Asterisks (*) represent P<0.05 for same-time/treatment comparisons between control and DJ-1 knock-down astrocytes by paired t-tests. Mean±SE shown, n=6. (A) DJ-1 knock-down significantly enhanced the 20 nM rotenone-induced reduction in red:green emission at 30 and 60 m. A similar trend persisted at 90 and 120 m. (B) DJ-1 knock-down significantly enhanced the 40 nM rotenone-induced reduction in red:green emission at all time points after toxin administration.
Fig. 8
Fig. 8
DJ-1 knock-down did not reduce oxygen consumption rates (OCR) in astrocyte-enriched cultures. Mitochondrial respiration was analyzed by measuring OCR in living astrocytes using a Seahorse XF24 analyzer. The OCR values were then normalized to total astrocyte numbers, as assessed by GFAP in-cell Western analysis, on the same plates. Control (solid lines) and DJ-1 knock-down (dashed lines) astrocytes were compared at baseline, after treatments with 0, 20, or 40 nM rotenone (A, B), and then after the addition of 500 nM FCCP (A). In each graph, same-time/treatment comparisons were made between control and DJ-1 knock-down astrocytes by paired t-tests. Mean±SE shown, n=5. (A) There was no difference between the OCR of control and DJ-1 knock-down astrocytes under any treatment condition over a 1 h period. However, as expected, rotenone treatment reduced the OCR, FCCP stimulated the OCR, and rotenone reduced the FCCP-induced stimulation. The data in this graph are expressed as percent control relative to OCR/GFAP values from same-time no rotenone/no FCCP control wells on the same plates. (B) Extended assessments over 24 h did not show any significant differences between the OCR of control and DJ-1 knock-down astrocytes, but did show the expected rotenone-induced reduction in OCR. The data in this graph are expressed as percent control relative to OCR/GFAP values from same-time no rotenone control wells on the same plates. For interpretation of the references to color in this figure legend, the reader is referred to the Web version of this article.
Fig. 9
Fig. 9
DJ-1 knock-down did not enhance extracellular acidification rates (ECAR) in astrocyte-enriched cultures. Mitochondrial glycolytic flux was analyzed by measuring ECAR in living astrocytes using a Seahorse XF24 analyzer. The ECAR values were then normalized to total astrocyte numbers, as assessed by GFAP in-cell Western analysis, on the same plates. Control (solid lines) and DJ-1 knock-down (dashed lines) astrocytes were compared at baseline, after treatments with 0, 20, or 40 nM rotenone (A, B), and then after the addition of 500 nM FCCP (A). In each graph, same-time/treatment comparisons were made between control and DJ-1 knock-down astrocytes by paired t-tests. Mean±SE shown, n=5. (A) There was no difference between the ECAR of control and DJ-1 knock-down astrocytes under any treatment condition over a 1 h period. However, as expected, FCCP (and, to a lesser extent, rotenone) stimulated the ECAR. The data in this graph are expressed as percent control relative to ECAR/GFAP values from same-time no rotenone/no FCCP control wells on the same plates. (B) Extended assessments over 24 h did not show any significant differences between the ECAR of control and DJ-1 knock-down astrocytes, but did show the expected rotenone-induced stimulation. The data in this graph are expressed as percent control relative to OCR/GFAP values from same-time no rotenone control wells on the same plates. For interpretation of the references to color in this figure legend, the reader is referred to the Web version of this article.

Similar articles

Cited by

References

    1. Aleyasin H, Rousseaux MW, Phillips M, Kim RH, Bland RJ, Callaghan S, Slack RS, During MJ, Mak TW, Park DS. The Parkinson’s disease gene DJ-1 is also a key regulator of stroke-induced damage. Proc Natl Acad Sci U S A. 2007;104:18748–18753. - PMC - PubMed
    1. Arnold B, Cassady SJ, VanLaar VS, Berman SB. Integrating multiple aspects of mitochondrial dynamics in neurons: age-related differences and dynamic changes in a chronic rotenone model. Neurobiol Dis. 2011;41:189–200. - PMC - PubMed
    1. Ascherio A, Chen H, Weisskopf MG, O’Reilly E, McCullough ML, Calle EE, Schwarzschild MA, Thun MJ. Pesticide exposure and risk for Parkinson’s disease. Ann Neurol. 2006;60:197–203. - PubMed
    1. Ashley AK, Hanneman WH, Katoh T, Moreno JA, Pollack A, Tjalkens RB, Legare ME. Analysis of targeted mutation in DJ-1 on cellular function in primary astrocytes. Toxicol Lett. 2009;184:186–191. - PMC - PubMed
    1. Ballard PA, Tetrud JW, Langston JW. Permanent human parkinsonism due to 1-methyl-4-phenyl-1,2,3,6-tetrahydropyridine (MPTP): seven cases. Neurology. 1985;35:949–956. - PubMed

Publication types

MeSH terms