. 2012 Jan;45(1):369-80.
doi: 10.1016/j.nbd.2011.08.024. Epub 2011 Aug 26.

Neuronal and glia abnormalities in Tsc1-deficient forebrain and partial rescue by rapamycin

Affiliations

Neuronal and glia abnormalities in Tsc1-deficient forebrain and partial rescue by rapamycin

Robert P Carson et al. Neurobiol Dis. 2012 Jan.

Abstract

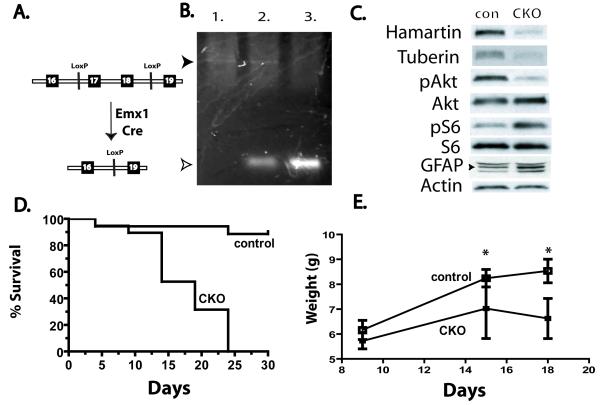
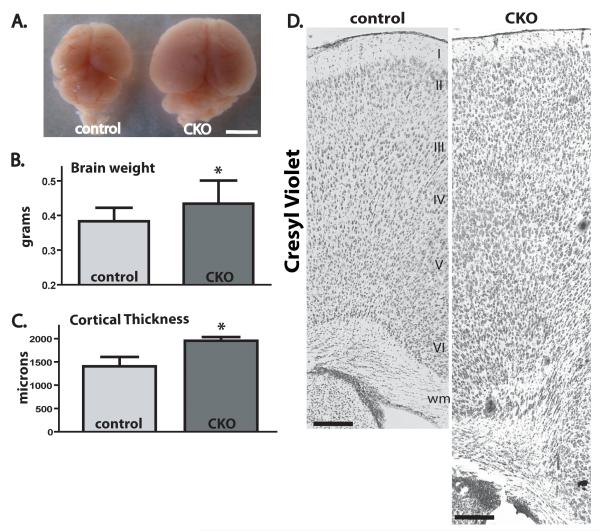
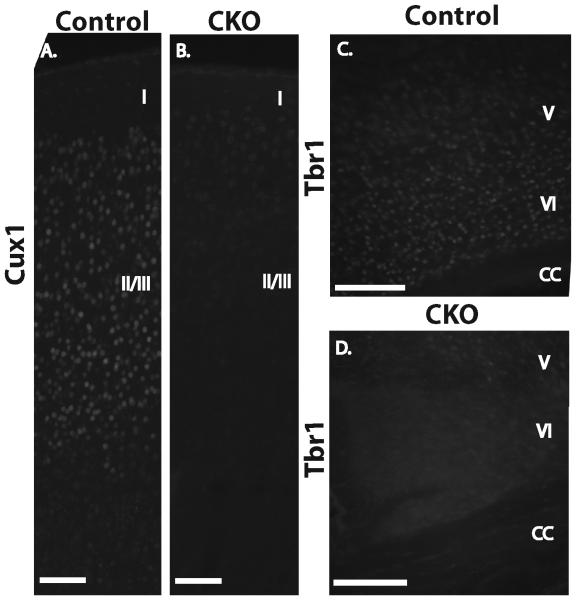
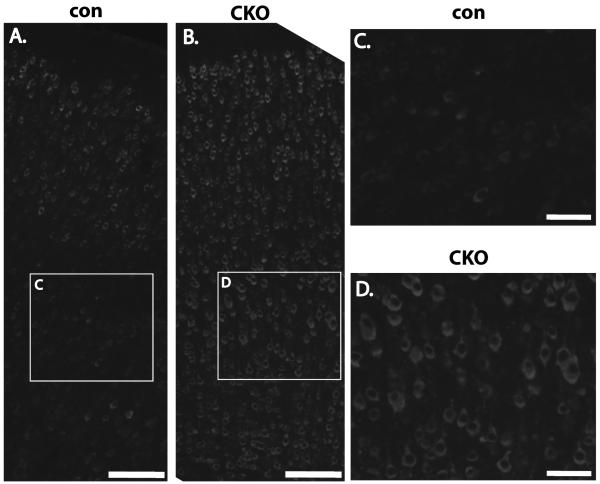
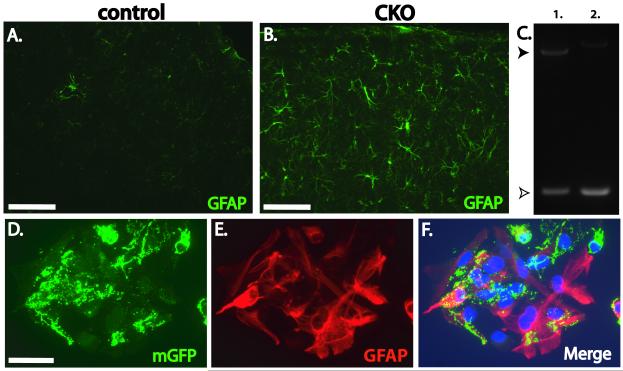
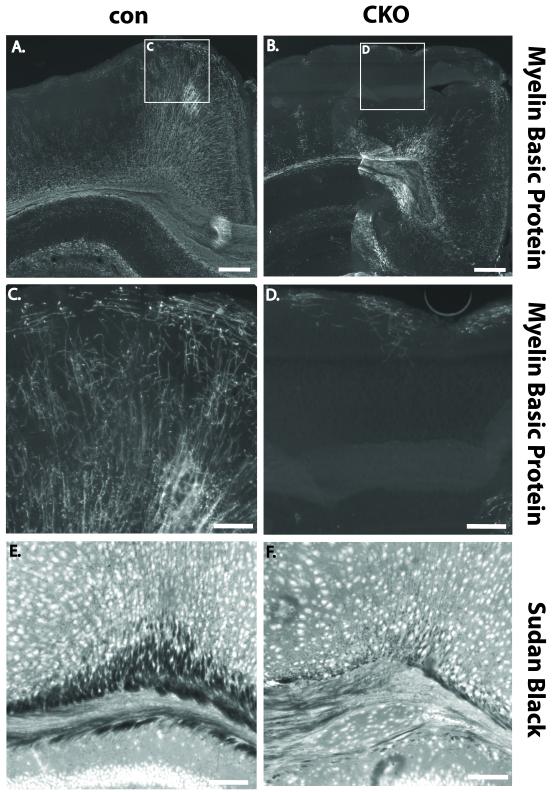
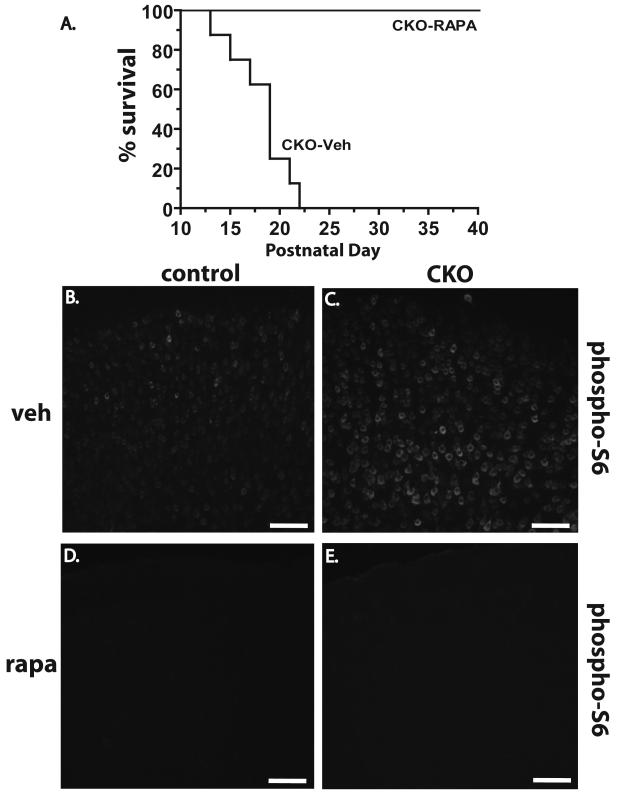
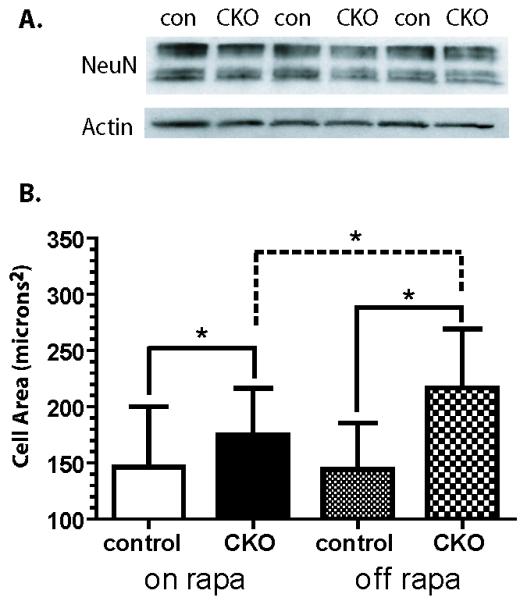
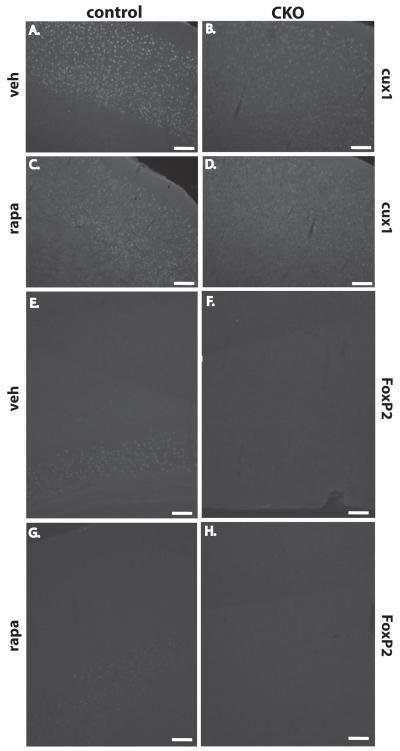
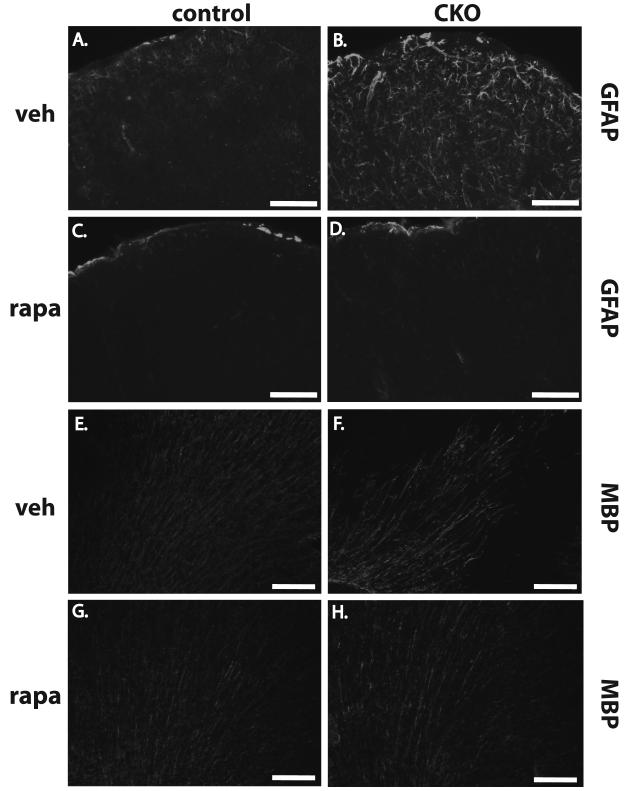
Tuberous Sclerosis Complex (TSC) is a multiorgan genetic disease that prominently features brain malformations (tubers) with many patients suffering from epilepsy and autism. These malformations typically exhibit neuronal as well as glial cell abnormalities and likely underlie much of the neurological morbidity seen in TSC. Tuber pathogenesis remains poorly understood though upregulation of the mTORC1 signaling pathway in TSC has been consistently demonstrated. Here we address abnormal brain development in TSC by inactivating the mouse Tsc1 gene in embryonic neural progenitor cells. This strategy permits evaluation of the role of the Tsc1 gene in both neuronal as well as glial cell lineages. Tsc1(Emx1-Cre) conditional knockout (CKO) animals die by 25 days of life. Their brains have increased size and contain prominent large cells within the cerebral cortex that have greatly increased mTORC1 signaling and decreased mTORC2 signaling. Severe defects of cortical lamination, enlarged dysmorphic astrocytes and decreased myelination were also found. Tsc1(Emx1-Cre) CKO mice were then treated with rapamycin to see if the premature death and brain abnormalities can be rescued. Postnatal rapamycin treatment completely prevented premature death and largely reversed the glia pathology but not abnormal neuronal lamination. These findings support a model that loss of function of the TSC genes in embryonic neural progenitor cells causes cortical malformations in patients with TSC. The dramatic effect of rapamycin suggests that even with extensive multi-lineage abnormalities, a postnatal therapeutic window may exist for patients with TSC.


Figures

Fig. 1
Fig. 1
Conditional inactivation of the Tsc1 gene in embryonic brain results in postnatal lethality, decreased weight, increased mTORC1 and decreased mTORC2 signaling. (A) Schematic of Tsc1 gene targeted by Cre recombinase. (B) Cre mediated recombination of the Tsc1 gene in dorsal cortex microdissected from E13.5 embryonic brain. Genotypes: 1. Tsc1 Flox/Flox; Cre negative, 2. Tsc1 Flox/wt heterozygote; Cre positive, 3. Tsc1 Flox/Flox homozygote; Cre positive (Tsc1Emx1-Cre CKO). Upper (closed) arrowhead indicates PCR product (2012 bp) of the unrecombined Tsc1 floxed allele, lower (open) arrowhead indicates PCR product (361 bp) from the recombined, inactivated Tsc1 allele. (C) Western blot of dorsal cortical extracts from representative P5 control and Tsc1Emx1-Cre CKO mice, n=4 for each group. Decreased hamartin and tuberin expression in seen as well as increased mTORC1 and decreased mTORC2 signaling with increased levels of phospho-S6 (Serine235/236) and decreased phospho-Akt (Serine 473) respectively. Changes in baseline levels of S6 or Akt were not seen. GFAP is also increased in the dorsal cortex from Tsc1Emx1-Cre CKO mice as compared to control littermates (C, also see Fig. 5B). Specific GFAP levels are seen by the lower two bands at 55 and 48 kD, with an upper non-specific band. Actin expression was used as a loading control. (D) Complete mortality of Tsc1Emx1-Cre CKO mice by postnatal day 25 compared to littermate controls. Log-Rank test, p<0.0001. (E) Decreased postnatal weight in Tsc1Emx1-Cre CKO mice (n=4) compared to littermate controls (n=9), error bars indicate standard deviation, asterisk denotes statistical significance using Students t-test p<0.05.
Fig. 2
Fig. 2
Increased brain size and cortical disorganization in Tsc1Emx1-Cre CKO mice. (A) Brain size in Tsc1Emx1-Cre CKO mice. Gross dorsal view of P20 control (left) and Tsc1Emx1-Cre CKO (right) brains, size bar equals 3.5 mm. (B) Increased weight of P20 brains from Tsc1Emx1-Cre CKO mice (n=12) compared to littermate controls (n=24). Asterisk denotes statistical significance using Students t-test, p=0.007. (C) Cortical thickness in P5 Tsc1Emx1-Cre CKO mice (n=3) compared to littermate controls (n=3). Asterisk denotes statistical significance using Students t-test, p=0.0112. (D) Cresyl violet staining in P20 control (left) and Tsc1Emx1-Cre CKO (right) mice shows increased cortical thickness and disorganization with apparent loss of lamination. Size bars equal 200 μm.
Fig. 3
Fig. 3
Diffuse expression of Cux1 (upper layer cortical marker, A,B) and Tbr1 (lower layer cortical marker, C,D) in brains from P5 Tsc1Emx1-Cre CKO mice (B,D) compared to control (A, C) mice. Magnification 20X. Size bars equal 100 μm for A, B and 200 μm for C,D.
Fig. 4
Fig. 4
Increased mTORC1 signaling in Tsc1-deficient forebrain. (A, B) Increased levels of phospho-S6 in the cortex of P20 Tsc1Emx1-Cre CKO mice as compared to controls. Size bars equal 150 mm. (C, D) Higher magnification of boxes in A, B showing large dysmorphic appearing neurons. Size bars equal 100 μm.
Fig. 5
Fig. 5
Increased GFAP expression in Tsc1Emx1-Cre CKO brains. (A, B) Minimal GFAP expression is seen in control somatosensory/motor cortex from control mice while GFAP expression is highly increased in Tsc1Emx1-Cre CKO mice. Size bar equals 50 μm. (C) Recombination of the Tsc1 gene in primary astrocyte cultures. Upper arrowhead (closed, 2012 bp) indicates wild type Tsc1 allele whereas the lower arrowhead (open, 361 bp) indicates the recombined and inactivated Tsc1 allele in astrocytes derived from heterozygote (lane 1) and homozygous (lane 2) conditional knockout brains. (D) Coexpression of membrane bound GFP (green) and GFAP (red) in astrocytes derived from ROSA dtT/mGFP mice. (F) Merge of (D) and (E). DAPI signal (blue) labels nuclei. Size bar equals 50 μm.
Fig. 6
Fig. 6
Decreased myelin in the cortex of Tsc1Emx1-Cre CKO mice. (A) Normal myelination pattern with myelin basic protein (MBP) expression in P20 control mice. (B) Greatly reduced MBP expression in frontal cortex of P20 Tsc1Emx1-Cre CKO mice. Patches of increased signal near the corpus callosum are artifact from digital reconstructions. Size bars equal 300 μm. (C, D) Higher magnification of boxes in A, B showing normal branching of myelinated axons in control mice but marked disruption in Tsc1Emx1-Cre CKO mice, size bars equal 100 μm. (E, F) Sudan black staining in the corpus callosum again showing reduced myelination in P20 Tsc1Emx1-Cre CKO mice compared to littermate controls. Size bars equal 200 μm.
Fig. 7
Fig. 7
Rescue of Tsc1Emx1-Cre CKO mice by postnatal treatment with rapamycin. (A) Complete survival of Tsc1Emx1-Cre CKO mice treated with rapamycin (CKO-Rapa, n=9) versus CKO mice treated with vehicle only (CKO-veh, n=6). Statistical significance of the increased survival of rapamycin treated Tsc1Emx1-Cre CKO mice determined using Log-rank test, p<0.001. (B-E) Reduction of mTORC1 activity in cortex of P40-44 Tsc1Emx1-Cre CKO and control mice treated with rapamycin compared to vehicle alone. Size bars equal 200 μm.
Fig. 8
Fig. 8
(A) NeuN Expression in Dorsal Cortex from Tsc1Emx1-Cre CKO and control mice. Total dorsal cortical extracts express similar levels of NeuN in P15 control and Tsc1Emx1-Cre CKO mice. Immunoblots using extracts from three control and Tsc1Emx1-Cre CKO mice are shown. Actin is used as a loading control. (B) Rapamycin decreases neuronal area in NeuN positive cells from control and Tsc1Emx1-Cre CKO brains treated with rapamycin. Rapamycin withdrawal allows further increases in area in CKO mice. Animals were treated with rapamycin form P15-40 (“on rapa”). An additional group of mice were treated from P15-40 and then euthanized at P55 approximately two weeks after cessation of rapamycin (“off rapa”). Asterisk denotes statistical significance using Students t-test, p<0.05.
Fig. 9
Fig. 9
Postnatal inhibition of mTORC1 does not alter abnormal cortical lamination. (A, B) Upper layer cortical marker cux1 is lost in P20 cortex from Tsc1Emx1-Cre CKO brains compared to control littermates. (C, D) Postnatal rapamycin treatment does not alter cortical lamination in P40-44 Tsc1Emx1-Cre CKO or control mice. Size bar equals 100 μm. Similar results are seen for the lower layer marker FoxP2 with much decreased expression seen in P20 cortex from Tsc1Emx1-Cre CKO brains (F) compared to control littermates. (E) Postnatal rapamycin treatment also does not alter expression of FoxP2 in P40-44 Tsc1Emx1-Cre CKO (H) or control (G) mice. Size bar equals 100 μm.
Fig. 10
Fig. 10
Postnatal inhibition of mTORC1 reverses glia abnormalities in the cortex of Tsc1Emx1-Cre CKO mice. (A-D) GFAP expression in P20 Tsc1Emx1-Cre CKO mice is reduced back to levels seen in control mice after treatment with rapamycin. Size bars equal 50 μm. (E-H) Expression of MBP in P40-44 Tsc1Emx1-Cre CKO mice is increased to levels approaching that seen in control mice after rapamycin treatment. Size bars equal 400 μm.

References

    1. Bissler JJ, et al. Sirolimus for angiomyolipoma in tuberous sclerosis complex or lymphangioleiomyomatosis. N Engl J Med. 2008;358:140–51. - PMC - PubMed
    1. Boer K, et al. Inflammatory processes in cortical tubers and subependymal giant cell tumors of tuberous sclerosis complex. Epilepsy Res. 2008;78:7–21. - PubMed
    1. Catania MG, et al. Hamartin expression and interaction with tuberin in tumor cell lines and primary cultures. Journal of Neuroscience Research. 2001;63:276–83. - PubMed
    1. Crino PB. Molecular pathogenesis of tuber formation in tuberous sclerosis complex. J Child Neurol. 2004;19:716–25. - PubMed
    1. Crino PB, et al. The tuberous sclerosis complex. N Engl J Med. 2006;355:1345–56. - PubMed

Publication types

MeSH terms