Review
. 2011 Sep;55(1):12-28.
doi: 10.1016/j.ymeth.2011.07.010. Epub 2011 Aug 31.

High-throughput protein purification and quality assessment for crystallization

Affiliations
Review

High-throughput protein purification and quality assessment for crystallization

Youngchang Kim et al. Methods. 2011 Sep.

Abstract

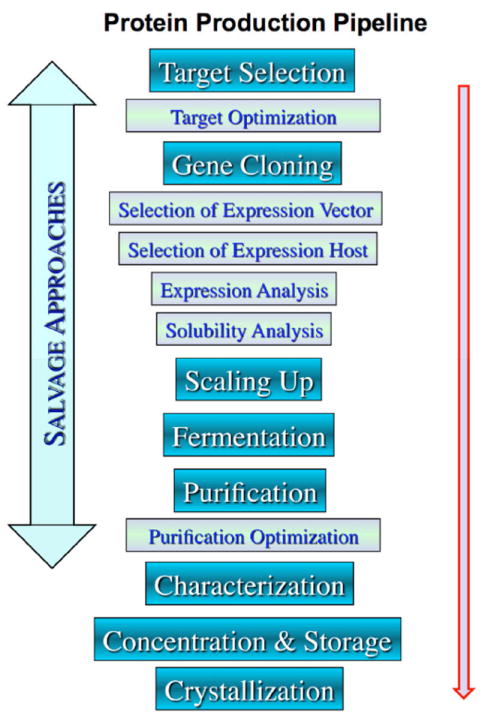
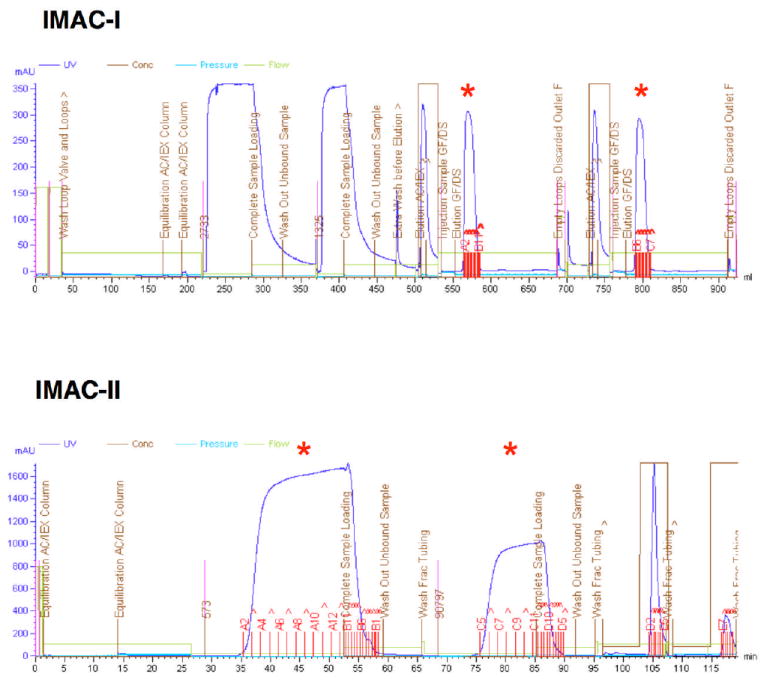
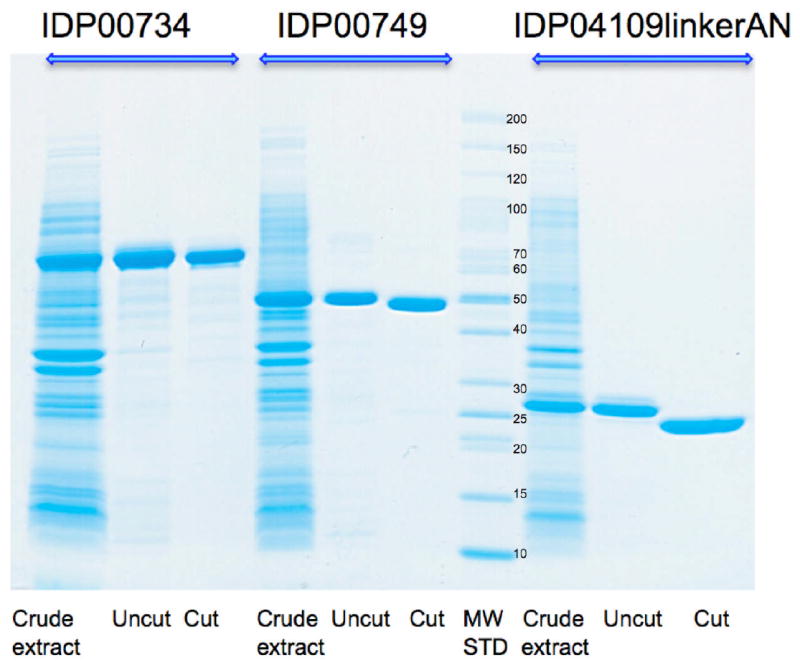
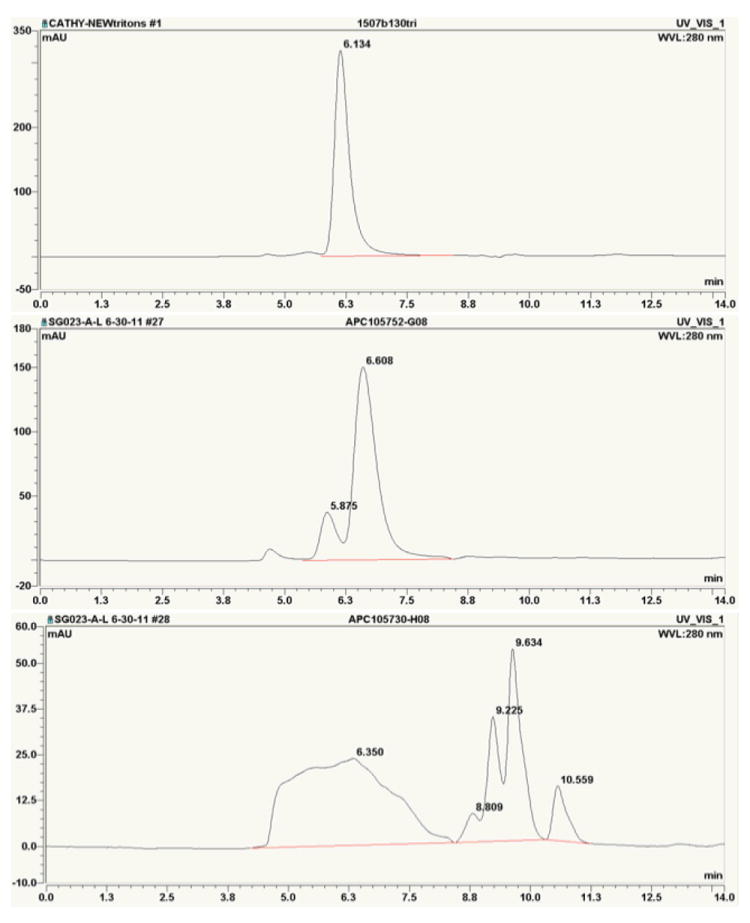
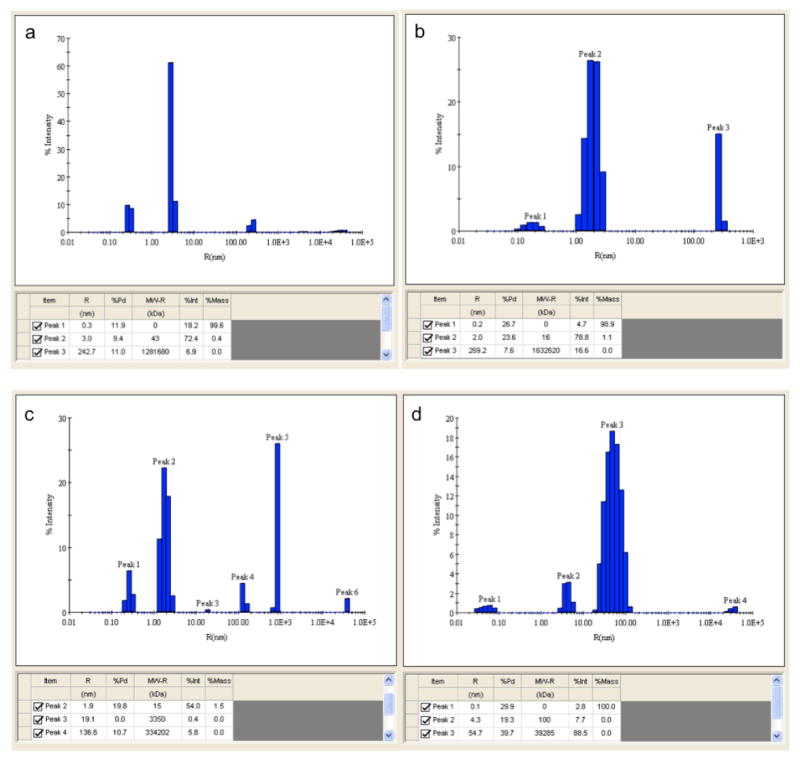
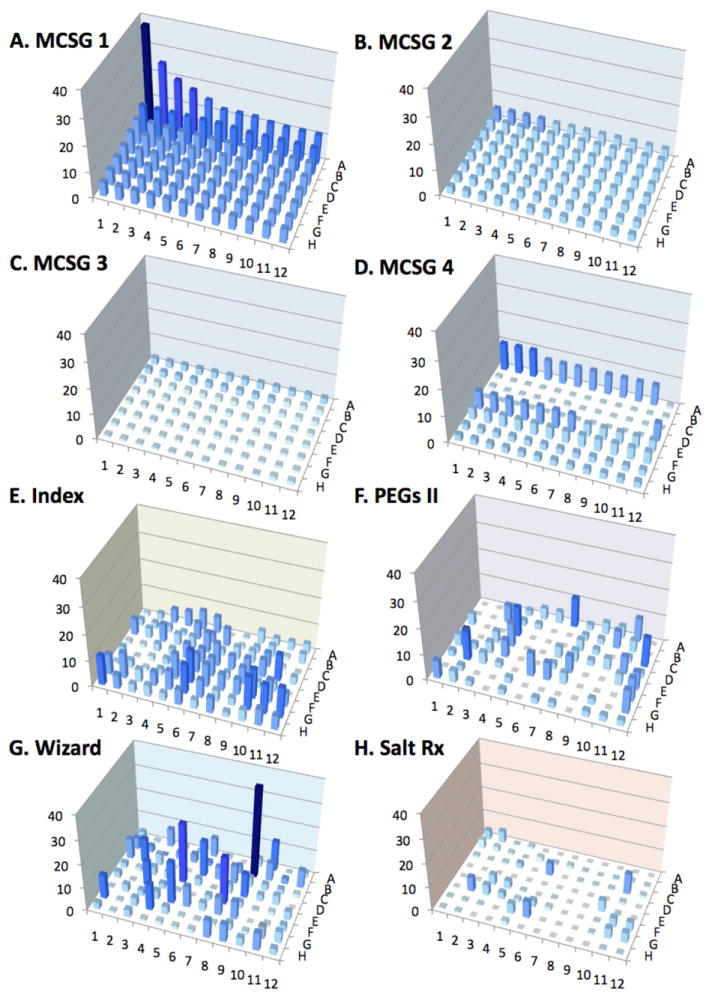
The ultimate goal of structural biology is to understand the structural basis of proteins in cellular processes. In structural biology, the most critical issue is the availability of high-quality samples. "Structural biology-grade" proteins must be generated in the quantity and quality suitable for structure determination using X-ray crystallography or nuclear magnetic resonance (NMR) spectroscopy. The purification procedures must reproducibly yield homogeneous proteins or their derivatives containing marker atom(s) in milligram quantities. The choice of protein purification and handling procedures plays a critical role in obtaining high-quality protein samples. With structural genomics emphasizing a genome-based approach in understanding protein structure and function, a number of unique structures covering most of the protein folding space have been determined and new technologies with high efficiency have been developed. At the Midwest Center for Structural Genomics (MCSG), we have developed semi-automated protocols for high-throughput parallel protein expression and purification. A protein, expressed as a fusion with a cleavable affinity tag, is purified in two consecutive immobilized metal affinity chromatography (IMAC) steps: (i) the first step is an IMAC coupled with buffer-exchange, or size exclusion chromatography (IMAC-I), followed by the cleavage of the affinity tag using the highly specific Tobacco Etch Virus (TEV) protease; the second step is IMAC and buffer exchange (IMAC-II) to remove the cleaved tag and tagged TEV protease. These protocols have been implemented on multidimensional chromatography workstations and, as we have shown, many proteins can be successfully produced in large-scale. All methods and protocols used for purification, some developed by MCSG, others adopted and integrated into the MCSG purification pipeline and more recently the Center for Structural Genomics of Infectious Diseases (CSGID) purification pipeline, are discussed in this chapter.


Figures

Figure 1
Figure 1
Main steps in protein production.
Figure 2
Figure 2
Family size distribution of the 12,000 protein families in the Pfam database. The largest family, the ABC transporters have nearly 130,000 members, while the smallest families, such as the conotoxins have 2 members.
Figure 3
Figure 3
The 2D map of crystallizability of YbaL from Escherichia coli. The pI (A), the GRAVY (B), and the MCSG Z-score (C) are calculated for all possible truncations of a given target and displayed in the web interface. The domain is highlighted in the 2D map (C) with the corresponding structure (D) shown. The X-axis denotes the start while the Y-axis denotes the end of a given construct of the protein sequence.
Figure 4
Figure 4
Purification of two His6-labeled proteins on IMAC-I (top) and IMAC-II after cleavage with TEV protease (bottom). Red asterisks show collected protein peaks.
Figure 5
Figure 5
SDS-PAGE of three CSGID proteins purified from crude extract using IMAC-I and IMAC-II. Molecular weight markers (EZ Run, from Fisher Scientific) are shown next to the protein bands.
Figure 6
Figure 6
Examples of ASEC separations of three proteins showing progressively higher (from top to bottom) levels of heterogeneity. The chromatography experiments used a Sepax SRT SEC-150 column (7.8 × 250 mm) on a DIONEX HPLC equipped with an AS temperature controlled autosampler housing two 96-well plate sample racks, GP50 Gradient Pump, and PDA-100 Photodiode Array Detector. The chromatography of 20–25 μL sample was run at 1.0 mL/min using buffer containing 20 mM HEPES pH 7.5 and 250 mM NaCl.
Figure 7
Figure 7
Examples of DLS regularization plots obtained for four different protein samples showing progressively higher heterogeneity and aggregation (from a to d). These plots show the distribution of different-size species with their compositions in hydrodynamic radius Rh (nm, x-axis) and % intensity (scattered light, y-axis). Polydispersity (Pd, %) and estimated molecular weight (kDa) are also shown in the table. In general, a %Pd of 15 or less is considered mono-dispersed and most un-aggregated proteins have an Rh of between 1–10 nm. In plot a, a mono-dispersed (9.4% Pd) un-aggregated protein (3 nm, 43 Kda) contributes to most of the scattering; in plot b, most of the intensity is raised from a less mono-dispersed (23.6%) but un-aggregated protein; plot c shows a non-homogenous sample as several different kinds of species, some un-aggregated, others aggregated, but most of them are mono-dispersed; and in plot d, most species are aggregated and poly-dispersed. The experiments used the DynaPro Plate Reader and the analyses were done by dynamics 6.10 software (Wyatt Technology).
Figure 8
Figure 8
Frequency of crystal appearance for different crystallization screens. This figure shows the frequency of crystals from different screens (vertical Z axis in ‰) vs 96 crystallization formulations (horizontal XY axis) using statistics from ten years of crystallization setups at MCSG. The top four screens were designed by the MCSG (MCSG-1,-2,-3,-4). The bottom four screens are commercially available screens most frequently used at MCSG. The frequency is shown by the shade of blue color (higher frequency corresponds to the darker shades of blue, while lower frequency corresponds to the lighter shades of blue).
Figure 9
Figure 9
The types of precipitants in MCSG screens. We analyzed the four screens designed by MCSG and found that they are very diverse with respect to types of precipitants. Screens are classified by five groups of precipitants: high MW PEG, low MW PEG, salt, organic chemicals, and polyalcohols. While all four screens contain the major groups of precipitants, each screen has differing amounts. MCSG-1 contains high MW PEG, both MCSG-2 and MCSG-3 contain salt, MCSG-3 -contains polyalcohols, and MCSG-4 - contains low MW PEG.

References

    1. Finn RD, Mistry J, Tate J, Coggill P, Heger A, Pollington JE, Gavin OL, Gunasekaran P, Ceric G, Forslund K, et al. The Pfam protein families database. Nucleic Acids Research. 2010;38:D211–D222. - PMC - PubMed
    1. Giglio MG, Collmer CW, Lomax J, Ireland A. Applying the Gene Ontology in microbial annotation. Trends Microbiol. 2009;17:262–268. - PubMed
    1. Pestka S. Production and analysis of proteins by recombinant DNA technology. Bioprocess Technol. 1990;7:235–265. - PubMed
    1. Studier FW. Protein production by auto-induction in high density shaking cultures. Protein Expr Purif. 2005;41:207–234. - PubMed
    1. Austin BP, Nallamsetty S, Waugh DS. Hexahistidine-tagged maltose-binding protein as a fusion partner for the production of soluble recombinant proteins in Escherichia coli. Methods Mol Biol. 2009;498:157–172. - PubMed

Publication types

LinkOut - more resources