. 2011 Sep 13;20(3):384-99.
doi: 10.1016/j.ccr.2011.08.013.

An integrated in vitro and in vivo high-throughput screen identifies treatment leads for ependymoma

Affiliations

An integrated in vitro and in vivo high-throughput screen identifies treatment leads for ependymoma

Jennifer M Atkinson et al. Cancer Cell. .

Abstract

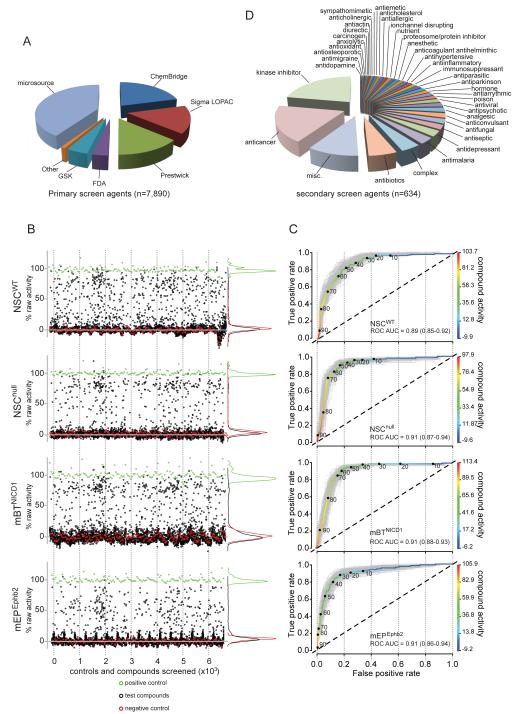
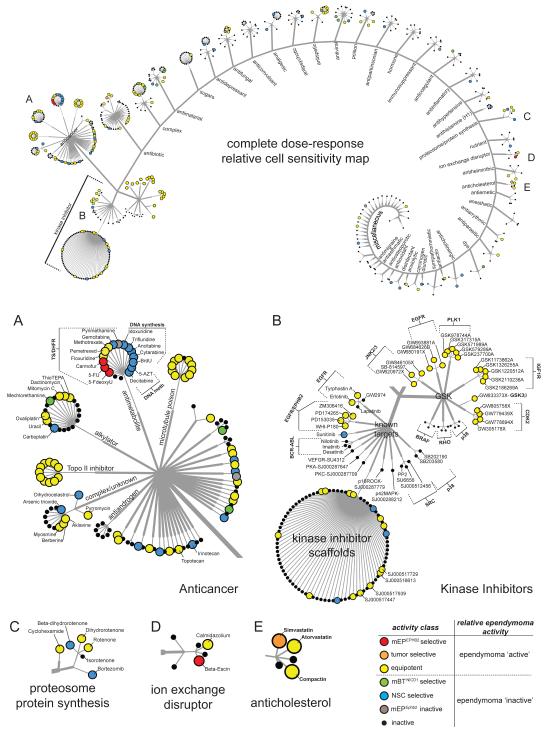
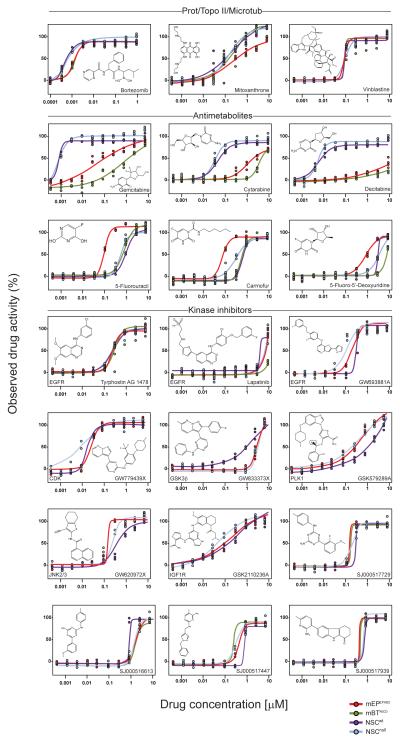
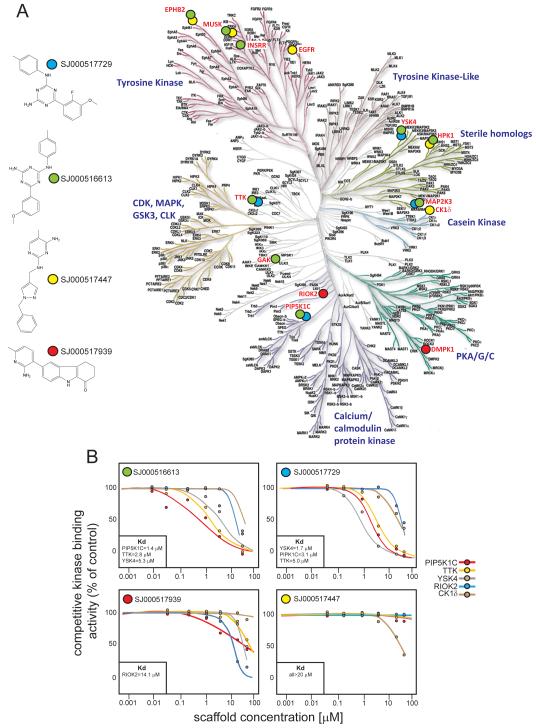
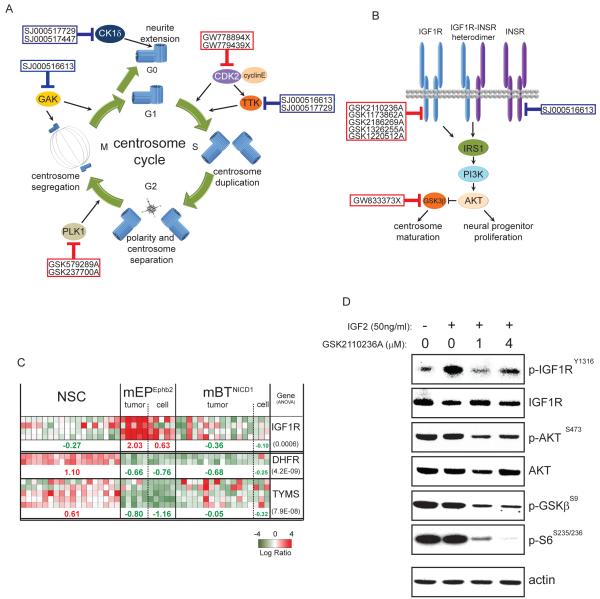
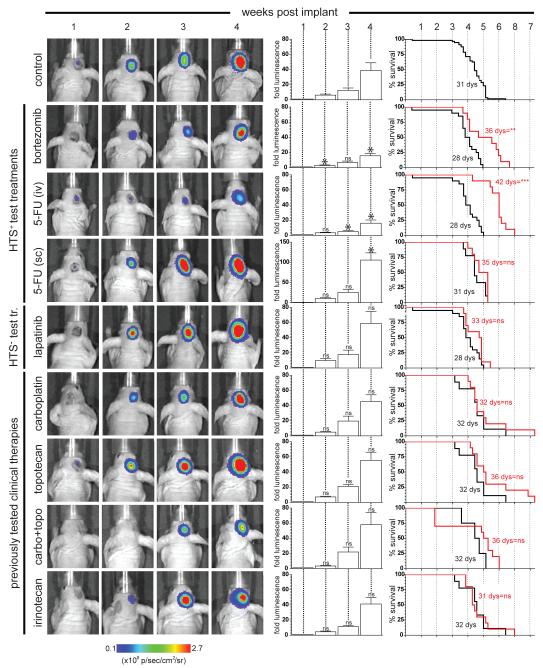
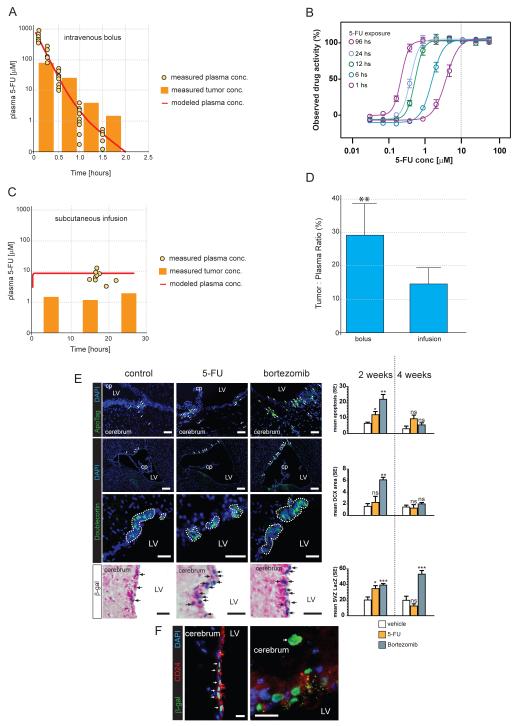
Using a mouse model of ependymoma-a chemoresistant brain tumor-we combined multicell high-throughput screening (HTS), kinome-wide binding assays, and in vivo efficacy studies, to identify potential treatments with predicted toxicity against neural stem cells (NSC). We identified kinases within the insulin signaling pathway and centrosome cycle as regulators of ependymoma cell proliferation, and their corresponding inhibitors as potential therapies. FDA approved drugs not currently used to treat ependymoma were also identified that posses selective toxicity against ependymoma cells relative to normal NSCs both in vitro and in vivo, e.g., 5-fluorouracil. Our comprehensive approach advances understanding of the biology and treatment of ependymoma including the discovery of several treatment leads for immediate clinical translation.


Figures

Figure 1
Figure 1. Compounds and quality control of the high throughput screen
A. Sources of compounds used in the screen. B. Scatter plot of percent primary screen activity (relative to vehicle) of positive controls (green) negative controls (red) and test compounds (black) for all four cell types. C. ROC analyses showing the true (y-axis) versus false (x-axis) positive rates of percent drug activity correlating the primary and secondary screens. The ROC curves in gray are calculated from 200 bootstrap simulations. Percent activity is color-coded according to the right y-axis. D. Drug classes represented by the 634 compounds tested in secondary screens. See also Figure S1.
Figure 2
Figure 2. Drug class network tree of cell-type specific potencies of 634 compounds subjected to secondary screening
Top figure shows compounds clustered according to major therapeutic indication and mechanism of action. A-E indicate the location of larger figures shown below. Activity was determined by dose response in secondary screening. Drug labels are colored according to cell-type activity as defined in the key (bottom right). See also Table S1.
Figure 3
Figure 3. Patterns of drug class sensitivity among cells
Dose response curves reveal distinct patterns of relative drug sensitivity among normal NSCs and tumor cells. The structure of the corresponding agent (and where appropriate molecular target) is shown in each graph.
Figure 4
Figure 4. Kinome-wide binding assay of ‘equipotent’ kinase inhibitor scaffolds
A. Left, four kinase inhibitor scaffolds with ‘equipotent’ activity in the HTS were subject to a single concentration (2.5 μM) competitive binding assay against 442 kinases in the human kinome (Right). Kinases bound with more than 50% activity relative to controls are marked with labels colored according to scaffold. B. Six point dose response Kd binding assays of scaffolds against selected kinases. Boxes show the Kd values (≤20 μM) for each kinase.
Figure 5
Figure 5. Kinase inhibitors active against mEPEphb2 target the centrosome cycle and insulin growth factor signaling pathway
Schematics of the centrosome cycle (A) and insulin growth factor pathway (B) marked with members of the ‘kinase inhibitor scaffold’ (blue boxes) and ‘GSK-PKIS’ (red boxes) libraries adjacent to their target molecules. C. Heatmaps reporting gene expression patterns in mouse cells and tumors (data from Johnson et al., 2010) of IGF1R, DHFR and TYMS. Figures below report the median Log Ratio of expression for each cell or tumor type and the number in parenthesis to the right the p-value for the ANOVA of this distribution. D. Western blot analysis of phosphorylated and total IGF1R, AKT, and phosphorylated GSK3β and S6 species in mEPEphb2 cells treated with the IGF1R kinase inhibitor GSK2110236A (or vehicle) followed by IGF2 stimulation.
Figure 6
Figure 6. In vivo efficacy against mEPEphb2 ependymomas of drugs displaying different activities in the HTS
Panels to the left show serial weekly bioluminescence scans of a single representative animal treated with the indicated drug(s). Central bar graphs report for the entire cohort of mice treated with the corresponding drug(s) the mean (±SD) weekly fold change in tumor bioluminescence relative to levels immediately following implantation. Asterisks in bar graphs of drug treated mice report whether the fold tumor bioluminescence at that time point differs from that observed in the control group. Graphs to the right report the survival of drug (red line) versus control (black line) treated mice in each cohort. In both graphs *, p=0.05; **, p=0.005; ***, p=0.0005 for the corresponding statistic. See also Figure S2.
Figure 7
Figure 7. Pharmacokinetics and in vivo toxicity of 5-FU
A. Concurrent measures of intratumoral and plasma 5-FU concentrations in 10 mice that each received a single intravenous injection of 75mg/kg of drug. B. In vitro washout studies of 5-FU activity against mEPEphb2 cells. Cells were incubated for the indicated time period with 5-FU and then to a total of 96 hours without drug. Dotted line denotes the concentration maintained in mEPEphb2 tumors in the brain for at least 1 hour following bolus administration. C. Concurrent measures of intratumoral and plasma 5-FU concentrations in 10 mice that received 13 mg/kg/hour of 5-FU via Alzet pumps. D. Percentage tumor:plasma AUC ratio of 5-FU delivered by 75mg/kg bolus injection and 13 mg/kg/hour infusion (**, p<0.005). E. Left: Top panel shows ApoTag stained apoptotic cells in the lateral SVZ of Prom1+/C-L mice following two weeks of vehicle control, 5-FU (75mg/kg bolus injection) or bortezomib treatment. Middle panels show low and high power images respectively of DCX+ neuroblast rests in the SVZ of the same mice. Bottom panel shows LacZ staining of the corresponding mice. Arrows indicate cells positive for the corresponding stain, dotted lines enclose DCX+ areas. Scale bar=50 μm, cp=choroid plexus, LV=lateral ventricle. Right: Graphs to the right report the patterns of for the corresponding stain in all three mice at each time point (*=p<0.05; ***=p<0.0005 relative to vehicle controls). F. Co-immunofluorescence of nuclear β-galactosidase expressed from the modified Prom1+/C-L locus and CD24. Left panel shows Prom1+/CD24+ ciliated ependymal cells. Panel to the right shows a Prom1+/CD24 cell (arrow) within the SVZ. Scale bar=20 μm.

References

    1. Adams J. The proteasome: a suitable antineoplastic target. Nat Rev Cancer. 2004;4:349–360. - PubMed
    1. Aguirre A, Rubio ME, Gallo V. Notch and EGFR pathway interaction regulates neural stem cell number and self-renewal. Nature. 2010;467:323–327. - PMC - PubMed
    1. Alsarra IA, Alarifi MN. Validated liquid chromatographic determination of 5-fluorouracil in human plasma. J Chromatogr B Analyt Technol Biomed Life Sci. 2004;804:435–439. - PubMed
    1. Baker KL, Daniels SB, Lennington JB, Lardaro T, Czap A, Notti RQ, Cooper O, Isacson O, Frasca S, Conover JC. Neuroblast protuberances in the subventricular zone of the regenerative MRL/MpJ mouse. The Journal of Comparative Neurology. 2006;498:747–761. - PubMed
    1. Berry DA, Cronin KA, Plevritis SK, Fryback DG, Clarke L, Zelen M, Mandelblatt JS, Yakovlev AY, Habbema JD, Feuer EJ. Effect of screening and adjuvant therapy on mortality from breast cancer. N Engl J Med. 2005;353:1784–1792. - PubMed

Publication types

MeSH terms