

Human connectomics
- PMID: 21908183
- PMCID: PMC3294015
- DOI: 10.1016/j.conb.2011.08.005
Human connectomics
Abstract
Recent advances in non-invasive neuroimaging have enabled the measurement of connections between distant regions in the living human brain, thus opening up a new field of research: Human connectomics. Different imaging modalities allow the mapping of structural connections (axonal fibre tracts) as well as functional connections (correlations in time series), and individual variations in these connections may be related to individual variations in behaviour and cognition. Connectivity analysis has already led to a number of new insights about brain organization. For example, segregated brain regions may be identified by their unique patterns of connectivity, structural and functional connectivity may be compared to elucidate how dynamic interactions arise from the anatomical substrate, and the architecture of large-scale networks connecting sets of brain regions may be analysed in detail. The combined analysis of structural and functional networks has begun to reveal components or modules with distinct patterns of connections that become engaged in different cognitive tasks. Collectively, advances in human connectomics open up the possibility of studying how brain connections mediate regional brain function and thence behaviour.
Copyright © 2011 Elsevier Ltd. All rights reserved.
Figures
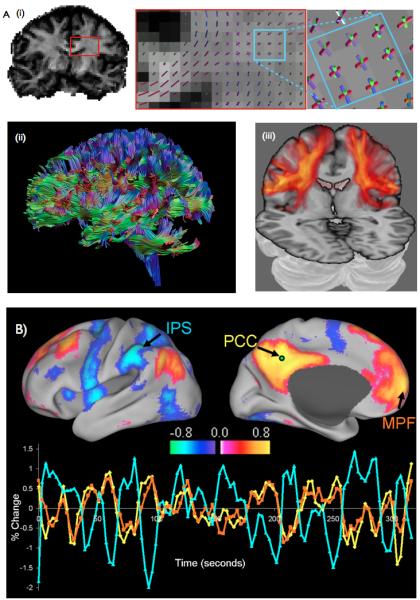
Measuring anatomical connections with diffusion imaging. (i) A map of diffusion anisotropy (left) reveals the orientational dependence on diffusion in white matter. Insets: The peak orientations of diffusion lie along coherent fibre bundles (middle). Complex fiber crossings can be resolved (right). For example here the corona radiata(blue/purple), callosal projections(red) and the superior longitudinal fasciculus (green) cross in the same voxels. (ii) Determinsitic tractography follows these peak diffusion orientations to reconstruct paths between distant brain regions. Image courtesy of Alexander Leemans. (iii) Probabilistic tractography reveals a distribution of probable connections from a single seed. Here, brighter and more opaque pixels display higher connection probability to ventral parietal region OP4. Image adapted from [17]
Functional connectivity can be measured using resting fMRI. Here we show two networks whose regions reproducibly exhibit correlated resting activity – the default mode network (red) and the dorsal attention network (blue). Three example timeseries are shown. Medial prefrontal fluctuations (orange) exhibit high correlation with posterior cingulate fluctuations (yellow), but not with intraparietal fluctuations (blue). Image taken from [78].
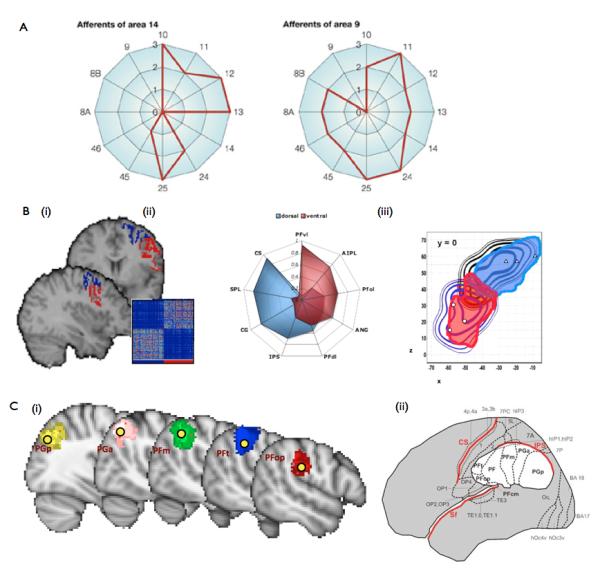
Invasive tracer studies in macaque monkey reveal that regions defined by their cyto-architecture also differ in their connectivity to other areas. Here we show afferent “connectivity fingerprints” for Walker’s area 9 and 14 in the prefrontal cortex. The two regions receive inputs from a markedly different set of other prefrontal regions. Figure adapted from [38].
(b) These connectional differences can be used to delineate cortical regions. (i)For example, a sharp change in connectivity exists between dorsal (PMd) and ventral (PMv) regions in lateral premotor cortex. Mathematical clustering techniques can detect these connectional differences (inset), which can be easily seen (ii) in their respective connectivity fingerprints to other cortical regions. (iii) As in similar studies, these connectivity-defined regions (solid regions) align well with delineations made solely on the basis of regional functional properties (contours). Images adapted from[45].
Connectivity-based parcellation can be applied to large patches of cortex. For example, 10 connectionally distinct regions can be identified in the parietal cortex [47]. Here we show (i) the 5 regions that lie in the inferior parietal lobule alongside (ii) a map of the same region, delineated by post-mortem cyto-architecture [83]. For ease of comparison, centres of gravity of the cytoarchiarchitectonic regions in (ii) are overlaid on the connectionally defined regions in (i). Images adapted from [46] and [79].
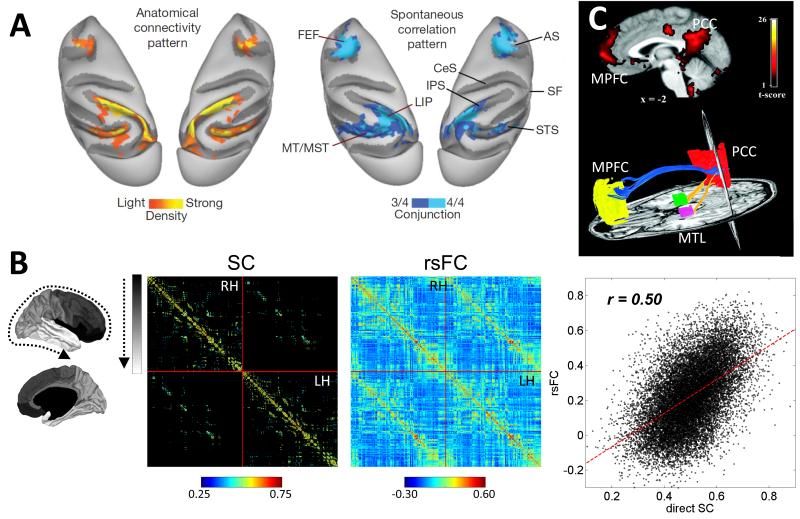
Anatomical connectivity, determined from tracer injections, and BOLD cross-correlations, recorded during spontaneous brain activity under anaesthesia, in macaque parietal and frontal cortex. Left panel shows map of retrogradely labelled brain regions after injection into area LIP (lateral intraparietal area). Right panel shows a map of voxels exhibiting BOLD correlations amongst at least 3 out of 4 regions of the monkey oculomotor system (FEF, frontal eye fields; LIP; MT, middle temporal area; MST, middle superior temporal area). AS, arcuate sulcus; CeS, central sulcus; IPS, intraparietal sulcus; SF; sylvian sulcus; STS, superior temporal sulcus. Image adapted from [53].
Average structural connectivity (SC) and resting-state functional connectivity (rsFC) matrices for 998 randomly partitioned regions of cerebral cortex obtained from diffusion tractography and fMRI recordings of the same cohort of participants [55]. Regions are arranged in a fronto-parietal-temporal gradient (indicated on the left) and connections are displayed for right hemisphere (RH), left hemisphere (LH) and interhemispheric pathways. The scatter plot on the right shows the relation between connection weights in SC and rsFC matrices.
Upper panels show resting-state functional connectivity in the default mode network, with regions in the posterior cingulate cortex/precuneus (PCC), medial prefrontal cortex (MPFC) and medial temporal lobe (MTL) exhibiting strong functional correlations. Lower panels show two views of diffusion imaging tractography of structural connections linking PCC and MPFC as well as PCC and MPFC in a single subject. Note the absence of direct MPFC/MTL connectivity. Images adapted from [52].
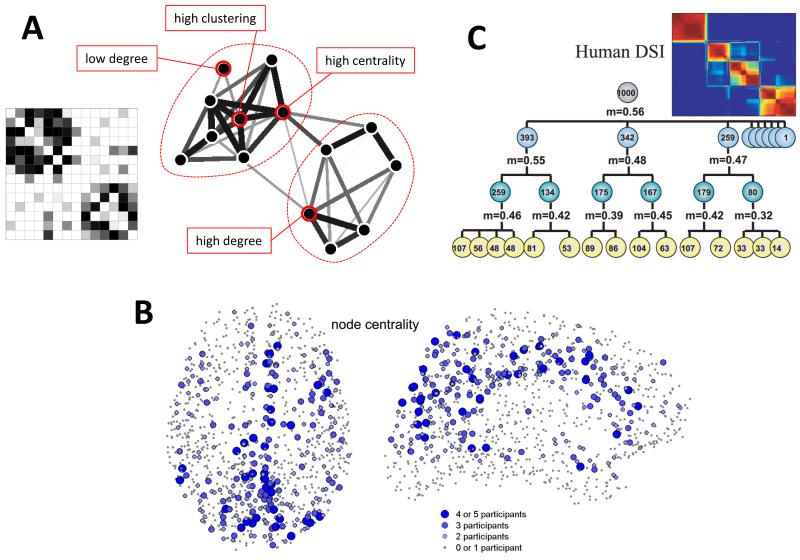
Schematic example of a weighted undirected connection matrix and the corresponding graph structure for a small network of 14 nodes. Nodes with high/low degree, high clustering and high centrality are indicated.
Anatomical distribution of a regionally measured graph metric, the betweenness centrality. Regions that exhibit consistently high centrality across a cohort of participants are labelled, and they are found to be aggregated along the cortical midline, and in parietal and prefrontal cortex. Image adapted from [66].
Hierarchical modularity in the structural connectivity of human cerebral cortex [55], as revealed by recursive application of a network-based partitioning algorithm. Modules at the largest scale can be further subdivided into nested communities, thus demonstrating that cortical modules extend across multiple scales. Image adapted from [75].
References
Publication types
MeSH terms
Grants and funding
LinkOut - more resources
Full Text Sources
