. 2011 Nov 24;118(22):5872-82.
doi: 10.1182/blood-2011-01-330407. Epub 2011 Sep 8.

Host-derived adiponectin is tumor-suppressive and a novel therapeutic target for multiple myeloma and the associated bone disease

Affiliations

Host-derived adiponectin is tumor-suppressive and a novel therapeutic target for multiple myeloma and the associated bone disease

Jessica A Fowler et al. Blood. .

Abstract

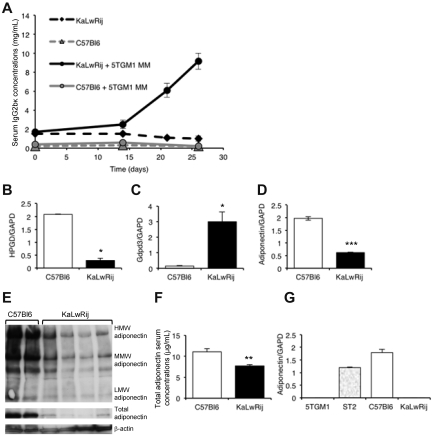
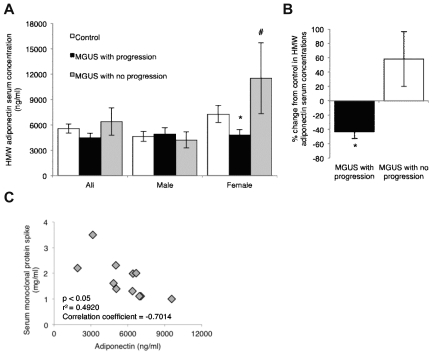
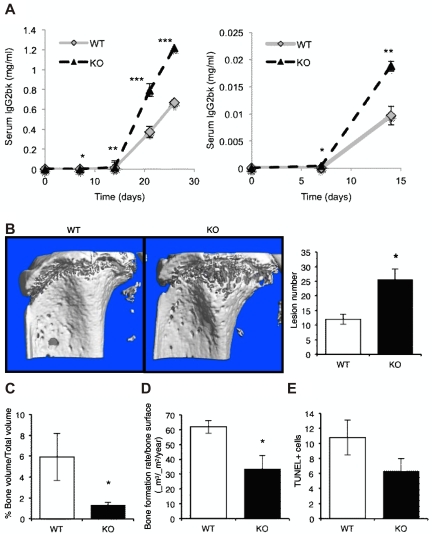
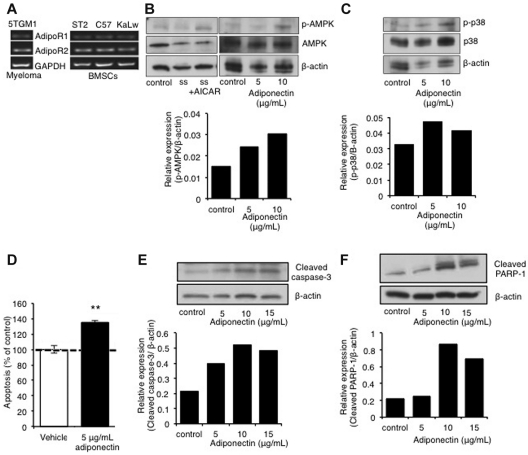
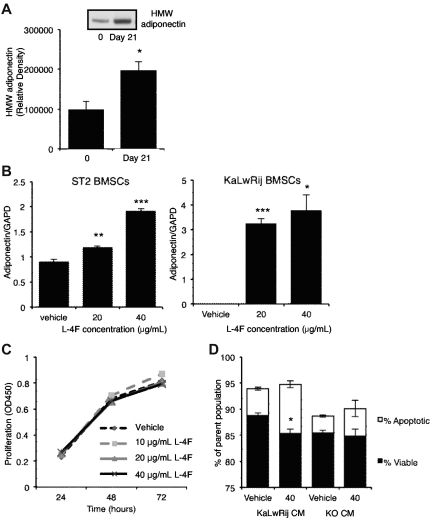
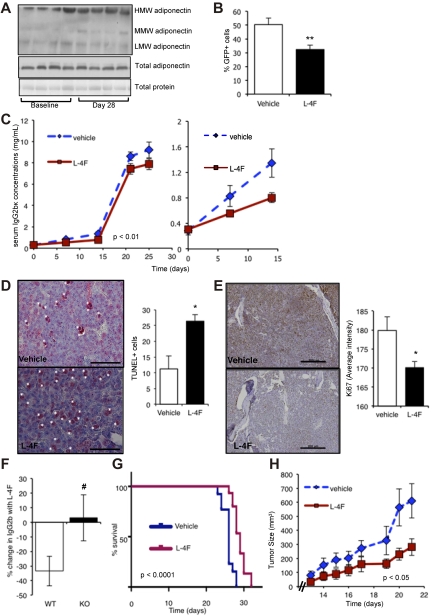
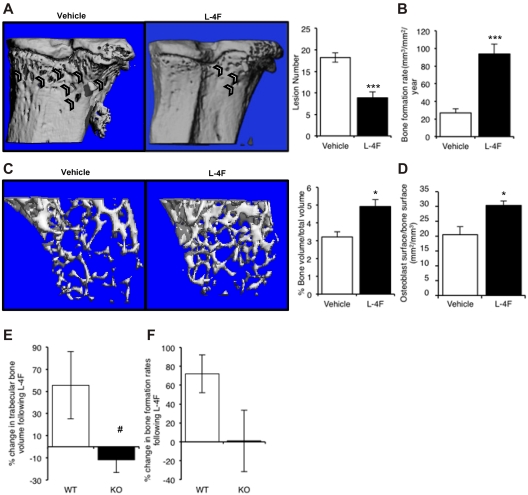
The contributions of the host microenvironment to the pathogenesis of multiple myeloma, including progression from the non-malignant disorder monoclonal gammopathy of undetermined significance, are poorly understood. In the present study, microarray analysis of a murine model requiring a unique host microenvironment for myeloma development identified decreased host-derived adiponectin compared with normal mice. In support, clinical analysis revealed decreased serum adiponectin concentrations in monoclonal gammopathy of undetermined significance patients who subsequently progressed to myeloma. We investigated the role of adiponectin in myeloma pathogenesis and as a treatment approach, using both mice deficient in adiponectin and pharmacologic enhancement of circulating adiponectin. Increased tumor burden and bone disease were observed in myeloma-bearing adiponectin-deficient mice, and adiponectin was found to induce myeloma cell apoptosis. The apolipoprotein peptide mimetic L-4F was used for pharmacologic enhancement of adiponectin. L-4F reduced tumor burden, increased survival of myeloma-bearing mice, and prevented myeloma bone disease. Collectively, our studies have identified a novel mechanism whereby decreased host-derived adiponectin promotes myeloma tumor growth and osteolysis. Furthermore, we have established the potential therapeutic benefit of increasing adiponectin for the treatment of myeloma and the associated bone disease.


Figures

Figure 1
Figure 1
Comparison of permissive KaLwRij and non-permissive C57Bl6 bone marrow microenvironments. (A) Tumor burden in non-permissive C57Bl6 and myeloma-permissive KaLwRij mice inoculated with 5TGM1 myeloma cells, determined by measuring myeloma-specific IgG2bκ concentrations. P < .01. n = 8. (B-D) Quantitative RT-PCR measurements of hydroxyprostaglandin dehydrogenase 15 (NAD HPGD), glycerophosphodiesterase domain containing 3 (Gdpd3), and adiponectin/GAPDH ratio in C57Bl6 and KaLwRij bone marrow. (E) Expression of adiponectin in bone marrow from C57Bl6 and KaLwRij mice was determined by Western blot. Each lane represents bone marrow from an individual mouse. (F) Serum concentrations of adiponectin in C57Bl6 and KaLwRij mice. (G) Quantitative RT-PCR measurements of adiponectin expression in 5TGM1 myeloma cells, and ST2, C57Bl6, and KaLwRij BM stromal cells (see also supplemental Figure 1). Data are mean ± SEM. *P < .05, **P < .01, and ***P < .001, compared with C57Bl6.
Figure 2
Figure 2
Decreased serum adiponectin concentrations in female MGUS patients are associated with progression to myeloma. (A) Concentration of HMW adiponectin in serum from matched controls and patients with MGUS that subsequently progressed or did not progress to myeloma. Data are subdivided to demonstrate differences between male and female (control, n = 40; MGUS with progression, n = 20; and MGUS no progression, n = 20). (B) Percentage decrease from matched control in HMW adiponectin serum concentrations in MGUS patients who either progress or do not progress to myeloma. (C) Adiponectin expression relative to serum monoclonal protein expression in patients with MGUS who progress to myeloma. (A-B) Data are mean ± SEM. *P < .05, compared with control. #P < .05, compared with MGUS with progression.
Figure 3
Figure 3
Lack of host-derived adiponectin exacerbates myeloma pathogenesis. (A) Female age-matched adiponectin-deficient (KO) mice or WT littermate controls were inoculated with 5TGM1 myeloma cells. Tumor burden was measured by serum IgG2bκ ELISA. Data demonstrate tumor burden with respect to time from tumor inoculation. Days 0 to 15 are expanded in the right panel graph to demonstrate differences in tumor burden at early time points. (B) Representative images of tibiae of myeloma-bearing WT and adiponectin knockout mice. Osteolytic lesions through cortical bone were quantitated after micro-CT analysis. (C) Trabecular bone volume was quantitated by micro-CT analysis. (D) Bone formation rates were quantitated by dynamic histomorphometry. (E) Using immunohistochemistry, apoptotic myeloma cells in bone marrow were quantitated based on TUNEL positivity (see also supplemental Figure 2 and supplemental Table 2). Data are mean ± SEM. *P < .05, **P < .01, and ***P < .001, compared with WT (WT, n = 3; KO, n = 6).
Figure 4
Figure 4
Adiponectin induces myeloma cell apoptosis. (A) Adiponectin receptor expression measured by RT-PCR in 5TGM1 myeloma cells, ST2, C57Bl6, and KaLwRij BMSCs. (B) Western blot of AMPK activation after treatment of 5TGM1 myeloma cells with 5 to 15 μg/mL adiponectin for 48 hours. (C) Western blot of p38 kinase activation after treatment of 5TGM1 myeloma cells with 5 to 10 μg/mL adiponectin for 48 hours. (D) Proportion of apoptotic 5TGM1 myeloma cells, as measured by annexin V/propidium iodide staining and flow cytometric analysis, after treatment with 5 μg/mL adiponectin for 48 hours. **P < .01, compared with control (data represent 3 independent experiments). (E) Western blot of cleavage of caspase 3 after treatment of 5TGM1 myeloma cells with 5 to 15 μg/mL adiponectin for 48 hours. (F) Western blot of cleavage of PARP-1 after treatment of 5TGM1 myeloma cells with 5 to 15 μg/mL adiponectin for 48 hours.
Figure 5
Figure 5
L-4F treatment increases circulating adiponectin in vivo and increases adiponectin expression by BMSCs. (A) Expression of HMW adiponectin, as measured by Western blot, in mice treated with L-4F for 21 days, compared with baseline. A representative Western blot image is shown. Data are mean ± SEM of 5 mice. *P < .05. (B) Quantitative real-time PCR measurement of adiponectin/GAPDH ratios in ST2 and KaLwRij BMSCs after treatment with L-4F for 48 hours. **P < .01 and ***P < .005, compared with control. (C) Myeloma cell proliferation, as measured by MTS assay, after treatment with 10 to 40 μg/mL L-4F for 24 to 72 hours. (D) Myeloma cells were treated with 20% conditioned media from KaLwRij or adiponectin knockout BMSCs that had been treated with 40 μg/mL L-4F or vehicle control. Apoptotic and viable cells were quantitated by annexin V/propidium iodide staining and flow cytometric analysis. *P < .05, compared with KaLwRij vehicle control. Data are mean ± SEM.
Figure 6
Figure 6
L-4F has anti-myeloma effects in vivo. (A) Western blot of the different molecular weight isoforms of adiponectin in serum of KaLwRij mice treated with L-4F for 28 days. Each lane represents serum from one mouse. (B) KalwRij mice were treated with L-4F for 28 days before inoculation of 5TGM1 myeloma cells. Treatment was continued for a further 25 days, at which point mice were killed. The proportion of GFP-positive myeloma cells in BM was quantitated by flow cytometry. **P < .01, compared with vehicle control. (C) KaLwRij mice were treated as described in panel B and tumor burden monitored by serum IgG2bκ ELISA. Two-way ANOVA demonstrated a significant difference in the rate of tumor development in L-4F-treated mice compared with control (P < .01). Days 0 to 15 are expanded in the second panel to demonstrate differences in tumor burden detectable at early time points. (D) Apoptotic myeloma cells in the BM were quantitated by TUNEL staining. A representative image is shown. White asterisks represent TUNEL-positive cells. Bar represents 50 μm. *P < .05, compared with vehicle control. (E) Proliferation was quantitated in the BM by immunostaining for Ki-67. Bars represent 200 μm. *P < .05, compared with vehicle control (Vehicle, n = 9; L-4F, n = 10). (F) Adiponectin-deficient mice (KO) or WT controls were treated with L-4F for 28 days before inoculation of 5TGM1 myeloma cells. Treatment was continued for a further 25 days, at which point mice were killed. Tumor burden was monitored by serum IgG2bκ ELISA. Data are expressed as percentage change in serum IgG2bk after treatment with L-4F. #P < .05 compared with WT. (G) KaLwRij mice were treated with L-4F for 28 days before inoculation of 5TGM1 myeloma cells. Treatment was continued until time of paraplegia, as a surrogate for survival. Data are displayed as a Kaplan-Meier plot, and a log-rank (Mantel-Cox) test demonstrated a significant increase in survival with L-4F treatment (P < .0001, n = 15). (H) KaLwRij mice were inoculated subcutaneously with 5TGM1 myeloma cells and treated with L-4F. Tumor volume was measured daily (Vehicle, n = 7; L-4F, n = 8). Two-way ANOVA demonstrated a significant difference in the rate of tumor development in L-4F-treated mice compared with control (P < .05). Data are mean ± SEM.
Figure 7
Figure 7
L-4F prevents myeloma bone disease and increases bone volume and bone formation in non–tumor-bearing mice. (A) KaLwRij mice were treated with L-4F for 28 days before inoculation of 5TGM1 myeloma cells. Treatment was continued for a further 25 days, at which point mice were killed. Representative images of tibiae of vehicle and L-4F treated are shown. Osteolytic lesions through cortical bone were quantitated after micro-CT analysis. Vehicle, n = 9; L-4F, n = 10. (B) Bone formation rates in myeloma-bearing control and L-4F–treated mice were quantitated by dynamic histomorphometry. (C) KaLwRij mice were treated with L-4F for 28 days. Micro-CT analysis demonstrated a significant increase in trabecular bone volume. N = 5 per group. (D) Osteoblast number in control and L-4F–treated mice was quantitated by histomorphometry. (E) Adiponectin-deficient mice (KO) or WT controls were treated with L-4F for 28 days before inoculation of 5TGM1 myeloma cells. Treatment was continued for a further 25 days, at which point mice were killed. Trabecular bone volume was quantitated by micro-CT analysis, and rates of bone formation were quantitated by dynamic histomorphometry (F). (E-F) Data are presented as percentage change in response to treatment with L-4F. Data are mean ± SEM. *P < .05 and ***P < .001, compared with vehicle. #P < .05, compared with WT.

Comment in

References

    1. Jemal A, Siegel R, Xu J, Ward E. Cancer statistics, 2010. CA Cancer J Clin. 2010;60(5):277–300. - PubMed
    1. Fowler JA, Edwards CM, Croucher PI. Tumor-host cell interactions in the bone disease of myeloma. Bone. 2010;48(1):121–128. - PMC - PubMed
    1. Radl J, Croese JW, Zurcher C, Van Den Enden-Vieveen MHM, Margreet de Leeuw A. Animal model of human disease: multiple myeloma. Am J Pathol. 1988;132(3):593–597. - PMC - PubMed
    1. Radl J, de Glopper E, Schuit HER, Zurcher C. Idiopathic paraprotienemia: II. Transplantation of the paraprotein-producing clone from old to young C587Bl/KaLwRij mice. J Immunol. 1979;122(2):609–613. - PubMed
    1. Fowler JA, Mundy GR, Lwin ST, Lynch CC, Edwards CM. A murine model of myeloma that allows genetic manipulation of the host microenvironment. Dis Model Mech. 2009;2(11):604–611. - PMC - PubMed

Publication types

MeSH terms