. 2011 Nov 1;71(21):6857-66.
doi: 10.1158/0008-5472.CAN-11-1818. Epub 2011 Sep 9.

Breast cancer subtype-specific interactions with the microenvironment dictate mechanisms of invasion

Affiliations

Breast cancer subtype-specific interactions with the microenvironment dictate mechanisms of invasion

Tuyen T Dang et al. Cancer Res. .

Abstract

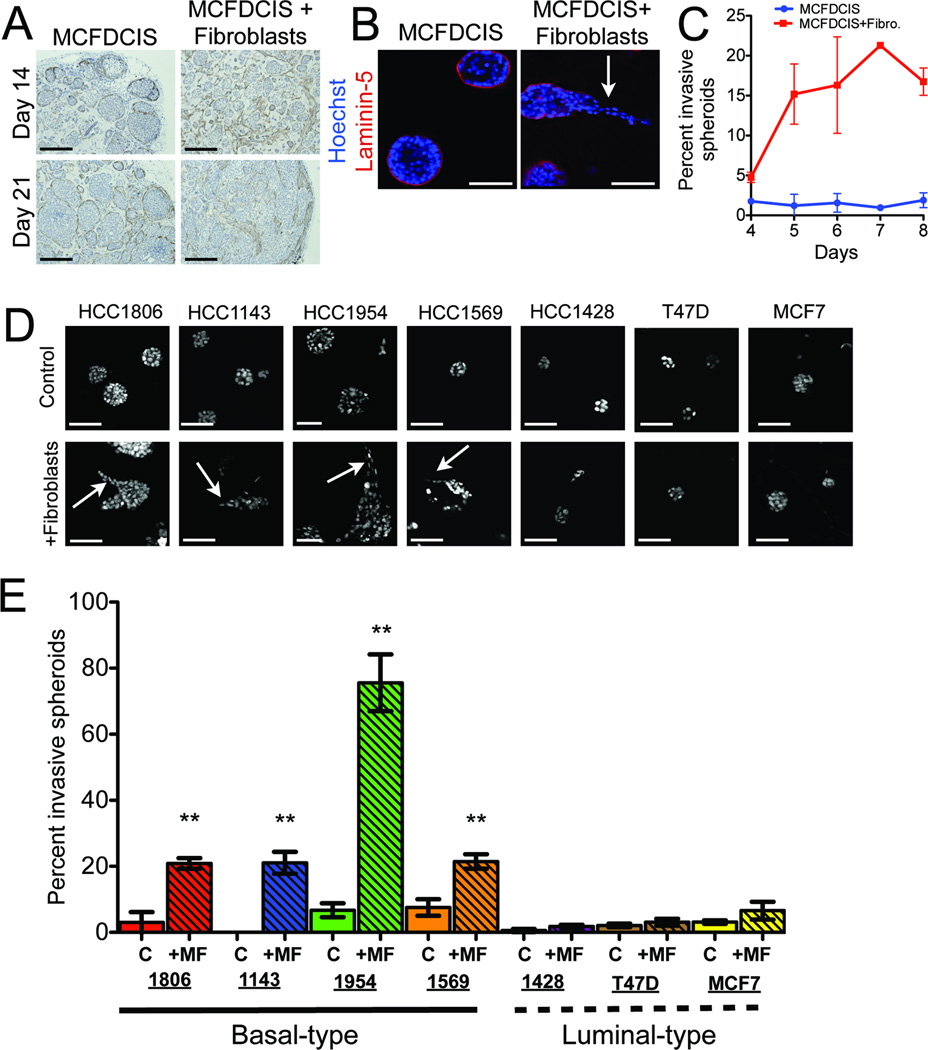
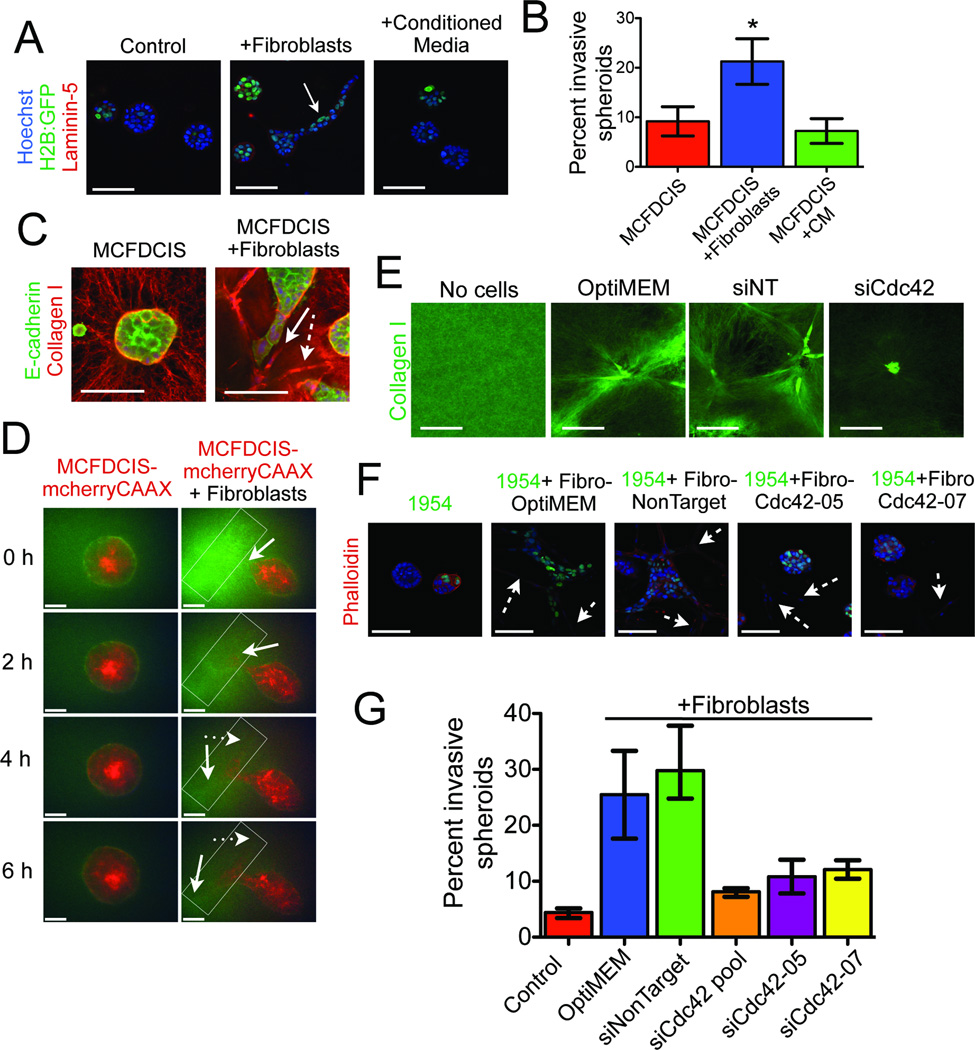
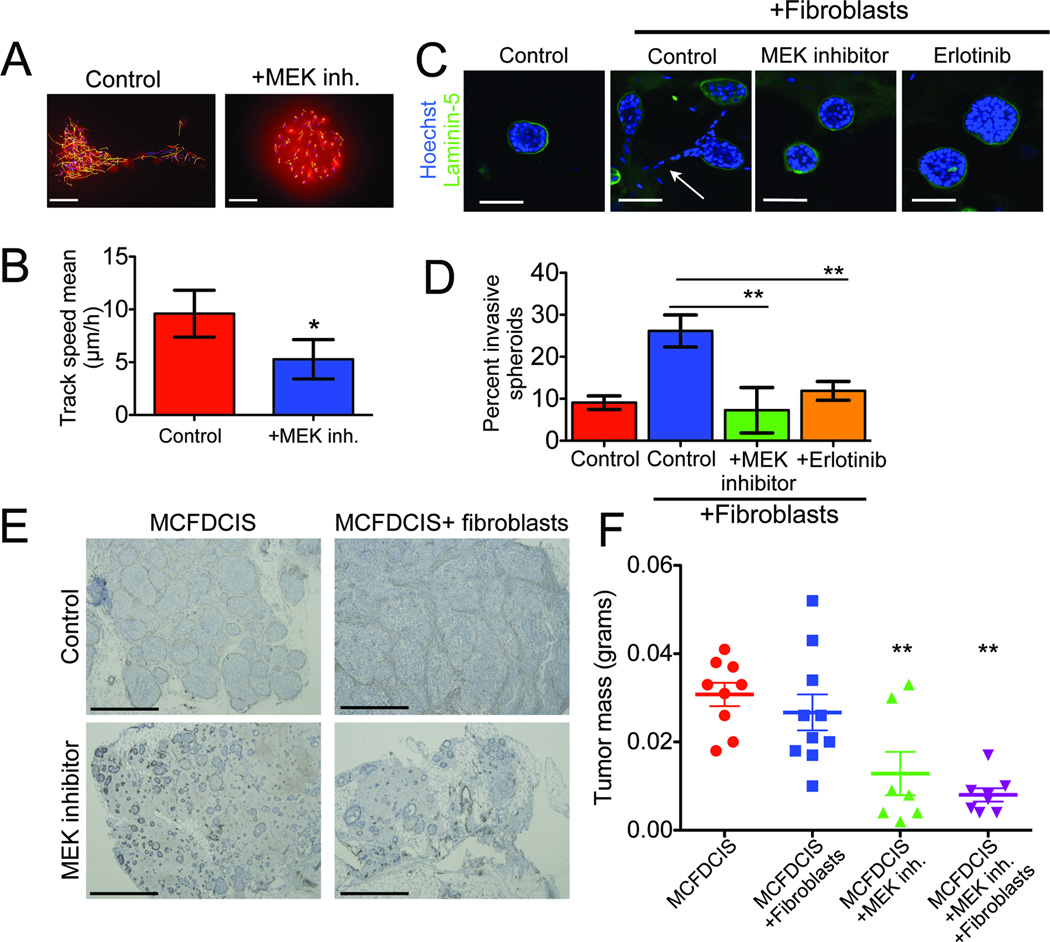
Most ductal breast carcinoma cells are weakly invasive in vitro and in vivo, suggesting that components of their microenvironment may facilitate a transition from in situ to invasive stages during progression. Here, we report that coculture of mammary fibroblasts specifically triggers invasive behavior in basal-type breast cancer cells through a ligand independent mechanism. When cultured alone in organotypic culture, both basal- and luminal-type breast cancer cells formed noninvasive spheroids with characteristics of ductal carcinoma in situ (DCIS). In contrast, when cocultured with mammary fibroblasts, basal-type spheroids exhibited invasive character whereas the luminal-type spheroids retained a benign and noninvasive duct-like architecture. Real-time imaging and functional studies revealed that the specificity of invasion was linked to a unique capacity of basal-type breast cancer cells to move within spheroids. Mammary fibroblasts induced invasion by triggering basal-type breast cancer cells to convert from a noninvasive program of mammary epithelial morphogenesis to an invasive program of sprouting endothelial angiogenesis. Contrary to the existing invasion models, soluble ligands produced by the fibroblasts were not sufficient to trigger invasion. Instead, basal-type invasion relied upon a Cdc42-dependent reorganization of collagen fibers in the extracellular matrix by fibroblasts. Inhibiting basal-type cell movement with clinically relevant drugs blocked invasion both in organotypic culture and in animals, suggesting a new treatment strategy for early-stage patients. Together our findings establish that fibroblast recruitment by basal-type breast cancer cells into early-stage tumors is sufficient to trigger their conversion from a benign, noninvasive DCIS-like stage to a malignant invasive stage. Furthermore, our findings suggest that different subtypes of breast cancer may require distinct types of contributions from the microenvironment to undergo malignant progression.


Figures

Figure 1
Figure 1. Fibroblasts specifically induce basal-type breast cancer cell invasion
A, MCFDCIS xenografts were removed on day 14 or day 21 of tumor growth. Paraffin-embedded tumor sections were immunostained with anti-smooth muscle actin antibody (brown), which stains the myoepithelial cell layer and mammary fibroblasts, and counterstained with hematoxylin (blue). Representative examples from 8 mice per condition are shown. Scale bars equal 200 µm. B, confocal images of organotypic cultures grown for 8 days and immunostained with α-laminin-5 antibody (red) and counterstained with Hoechst (blue, nuclei) are shown. Scale bars equal 100 µm. The white arrow identifies an example area of invasion. C, quantification of the frequency of invasion induced by mammary fibroblasts over time in MCFDCIS co-cultures. See the Methods section for details. Data are the mean +/− the standard deviation (S.D.). The quantification includes results with mammary fibroblasts isolated from three different patients. No difference in frequency of invasion was observed comparing fibroblasts from matched benign and neoplastic tissues. D, organotypic cultures were grown for eight days and fixed with formalin. H2B:GFP (HCC1143, HCC1569, T47D) or H2B:mCherry (HCC1806, HCC1954) expression in the breast cancer cells or Hoechst staining (MCF7) is shown (nuclei, white). Scale bars equal 100 µm. Solid white arrows indicate example areas of invasion. E, quantification of the frequency of invasion induced by mammary fibroblasts. Data are the mean +/− S.D. **, P <0.01 versus no fibroblast control by t-test.
Figure 2
Figure 2. Mammary fibroblasts induce motile neoplastic cells to collectively invade
A, confocal slices of MCFDCIS-mCherryCAAX cells (plasma membrane, red) cultured alone (left) or with mammary fibroblasts expressing GFP (green, right) are shown at 1.5 h intervals over 4.5 h total. The white arrow indicates where the MCFDCIS cell begins sprouting invasion away from the main spheroid. Scale bars equal 20 µm. B, confocal slices of MCFDCIS-H2B:mCherry cells (nuclei, red) cultured alone or with mammary fibroblasts are shown 2 h intervals over 8 h total. The white arrow indicates where a MCFDCIS cell begins branching away from the original invasive track of cells. Scale bars equal 20 µm. C, confocal slices of MCFDCIS-H2B:mCherry cells (red) cultured alone (left) or with mammary fibroblasts (right) are shown at 4.5 h intervals over 13.5 h total. The solid white arrow indicates where MCFDCIS cells begin migrating away from the original track of invasive cells. The dashed white arrow shows a different MCFDCIS cell invading away from the main spheroid along the existing invasive projection of cells. All scale bar equal 20 µm. The results are representative of over 30 spheroids imaged per condition over 3 independent experiments.
Figure 3
Figure 3. Only basal-type breast cancer cells are capable of intraspheroid motility and invasion
A, quantification of the speed and displacement of cells over 14 hours. The low level speed and displacement of the luminal-type spheroids is due to cell division and stochastic movement resulting from modest stage drift. Vertical scatterplots of the mean speed and displacement of fifteen spheroids per cell line over three independent experiments are shown. Horizontal bars are the mean for each cell line. Error bars are +/− S.D. ***, P <0.001 compared to HCC1428 by Mann Whitney U test. B, time-lapse confocal slices of the indicated breast cancer spheroids cultured alone or with mammary fibroblasts. H2B:GFP (nuclei, white) expression is shown. The position of two cells in each spheroid is indicated by solid and dashed white arrows. Scale bars equal 20 µm. The results are representative of 30 spheroids imaged per condition over 3 independent experiments.
Figure 4
Figure 4. Cdc42 expression in fibroblasts is required for collagen reorganization and basal type breast cancer invasion
A, organotypic cultures were grown for 6 days, immunostained with α-laminin 5 antibody (basement membrane, red) and counterstained with Hoechst (nuclei, blue). Conditioned media from the mammary fibroblasts was added on day 2 and day 4. The white arrow identifies an area of invasion. Scale bars equal 100 µm. B, quantification of the frequency of invasion. Data are the mean +/− S.D. *, P <0.05 versus no fibroblast control by t-test. C, confocal slices of organotypic cultures immunostained with anti-collagen I (red) and anti-E-cadherin (green) antibodies and counterstained with Hoechst (nuclei, blue) are shown. A solid white arrow indicates the direction of invasion and a dotted white arrow shows a nearby fibroblast. Scale bars equal 100 µm. D, confocal slices of MCFDCIS-mCherryCAAX cells (red) cultured alone or with mammary fibroblasts. FITC-labeled collagen I is shown in green. The invasion of MCFDCIS-mCherryCAAX cells at 2 h intervals over 6 h total is shown. The area of collagen remodeling, indicated by increased fluorescent signal intensity, is outlined with a white rectangle. Photobleaching decreases the FITC-collagen signal over time. The solid white arrow indicates where the MCFDCIS cell begins sprouting invasion away from the main spheroid. The dotted white arrow indicates a branch point in the invasion as the MCFDCIS cells spread through the perpendicular region of reorganized collagen containing a fibroblast. Scale bars equal 20 µm. The results are representative of 30 spheroids imaged per condition over 3 independent experiments. E, confocal slices of transfected fibroblasts after 4 days in organotypic culture were immunostained with anti-collagen I antibody (green) and counterstained with phalloidin (F-actin, red) and Hoechst (nuclei, blue). Scale bars equal 100 µm. F, confocal slices of HCC1954 spheroids co-cultured with fibroblasts transfected with the indicated siRNA pools are shown. Cultures were fixed and stained with phalloidin (F-actin, red) and Hoechst (nuclei, blue) after 6 days of growth. Dashed white arrows identify areas containing fibroblasts. G, quantification of the frequency of invasion. The mean +/− the range of at least 2 independent experiments is shown.
Figure 5
Figure 5. EGFR and ERK1/2 are necessary for intraspheroid motility and fibroblast induced invasion
A, MCFDCIS co-cultured with unlabeled fibroblasts were treated on day 4 and day 6 with diluent or 100 nM PD0325901. Real-time imaging of the MCFDCIS spheroids was performed on day 6. The movement of cells over time is indicated by the length of the tracks. The H2B:mCherry-labeled nuclei are in red and are located at their respective positions after 8 h of tracking. The results shown are representative of at least 10 spheroids imaged per condition in three independent experiments. Scale bars equals 40 µm. B, quantification of average cell speed in spheroids co-cultured with fibroblasts and treated with diluent or 100 nM PD0325901 on day 4 and then imaged for 14 h. Data are the mean +/− S.D. of 15 spheroids imaged in three independent experiments. *, P <0.05 by t-test. C, MCFDCIS co-cultures were grown for 4 days and then treated with diluent, 100 nM PD0325901 or 1 µM Erlotinib. On day 6 the cultures were fixed and immunostained with α-laminin 5 antibody (green, basement membrane and counterstained with Hoechst (blue, nuclei). A white arrow identifies an example area of invasion. Scale bars equal 100 µm. D, quantification of the frequency of invasion for inhibitor treated co-cultures. Data are the mean +/− S.D. **, P <0.01 by t-test compared to fibroblast induced invasion. E, MCFDCIS xenografts were treated daily with either diluent or 25 mg/kg PD0325901 starting on day 14 of tumor growth until the animals were sacrificed on day 21. Paraffin-embedded tumor sections were immunostained with anti-smooth muscle actin antibody. Representative examples of at least eight mice per treatment condition are shown. Scale bars equal 500 µm. F, quantification of the tumor weights of the control and PD0325901 treated mice. Mean +/− standard error of the mean is shown. **, P <0.01 by t-test compared to corresponding diluent treated control.

References

    1. Burstein HJ, Polyak K, Wong JS, Lester SC, Kaelin CM. Ductal carcinoma in situ of the breast. N Engl J Med. 2004;350:1430–1441. - PubMed
    1. Hanahan D, Weinberg RA. The hallmarks of cancer. Cell. 2000;100:57–70. - PubMed
    1. Conklin MW, Eickhoff JC, Riching KM, et al. Aligned collagen is a prognostic signature for survival in human breast carcinoma. Am J Pathol. 178:1221–1232. - PMC - PubMed
    1. Yamaguchi H, Wyckoff J, Condeelis J. Cell migration in tumors. Curr Opin Cell Biol. 2005;17:559–564. - PubMed
    1. Sahai E, Wyckoff J, Philippar U, Segall JE, Gertler F, Condeelis J. Simultaneous imaging of GFP, CFP and collagen in tumors in vivo using multiphoton microscopy. BMC Biotechnol. 2005;5:14. - PMC - PubMed

Publication types

MeSH terms