

A kinome-wide screen identifies the insulin/IGF-I receptor pathway as a mechanism of escape from hormone dependence in breast cancer
- PMID: 21908557
- PMCID: PMC3206206
- DOI: 10.1158/0008-5472.CAN-11-1295
A kinome-wide screen identifies the insulin/IGF-I receptor pathway as a mechanism of escape from hormone dependence in breast cancer
Abstract
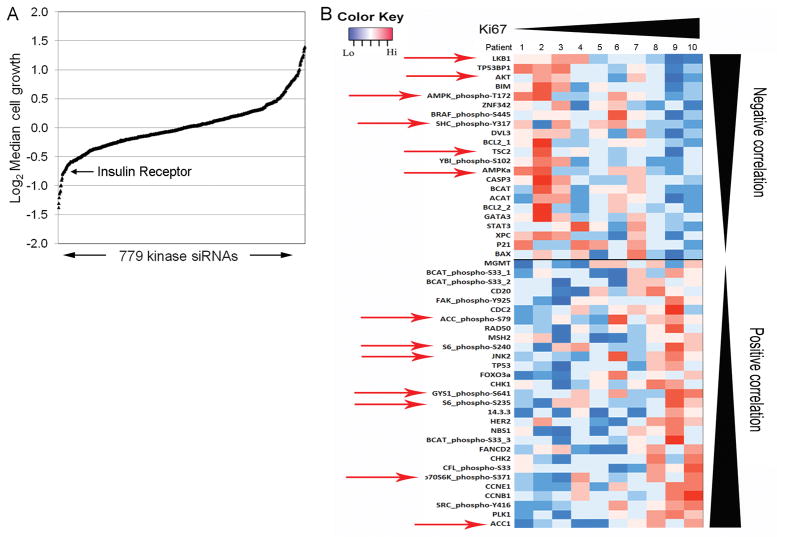
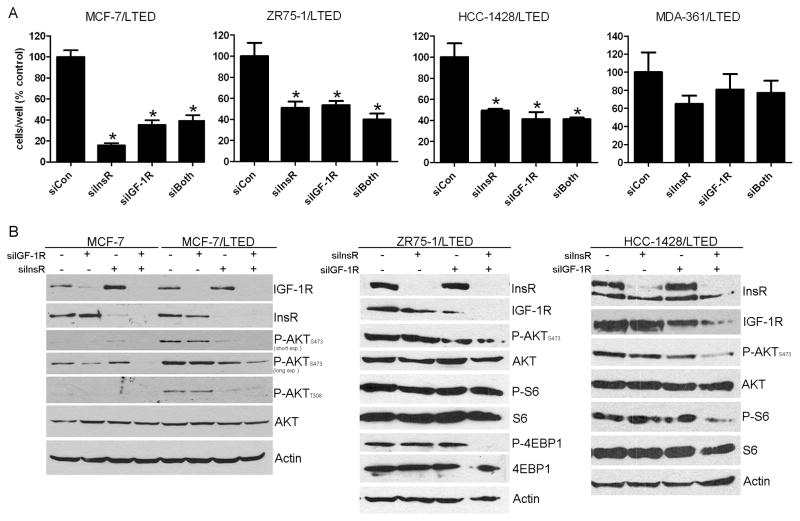
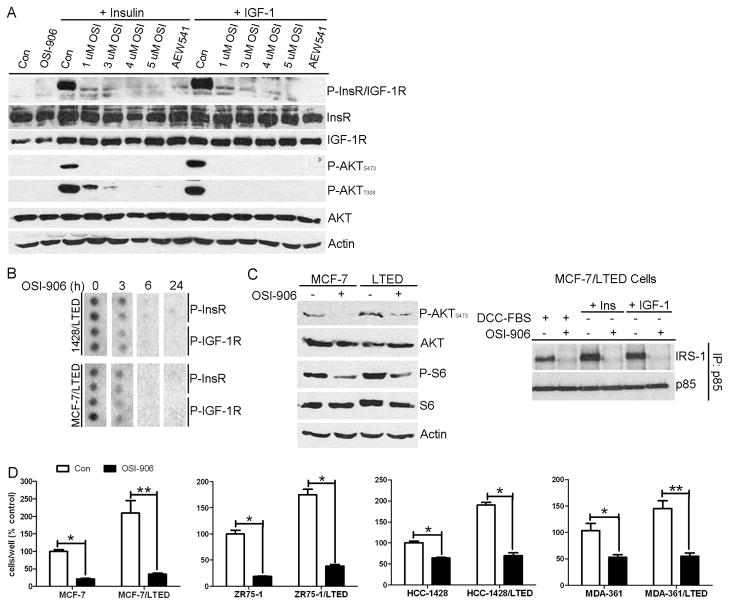
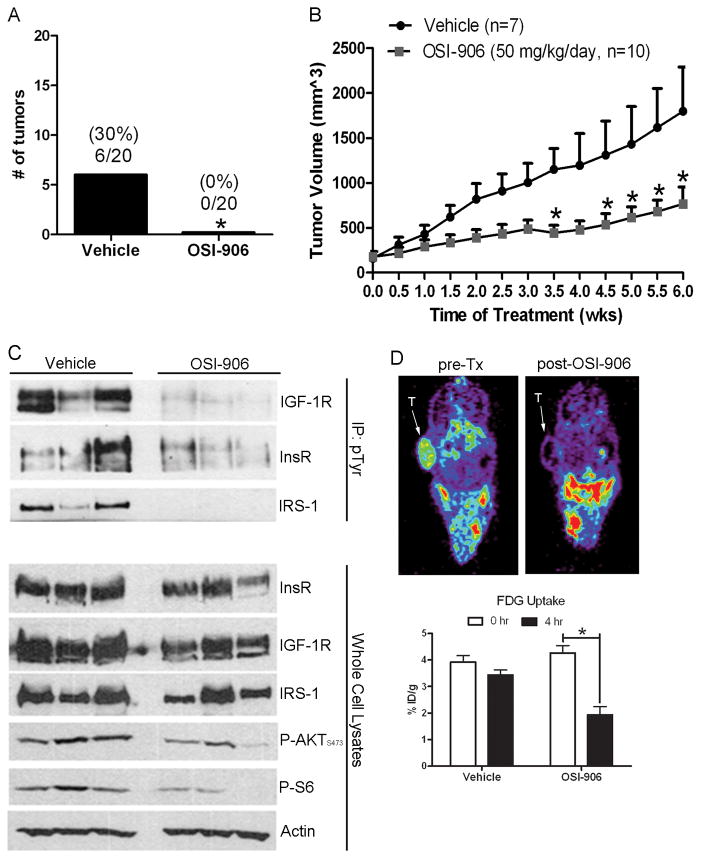
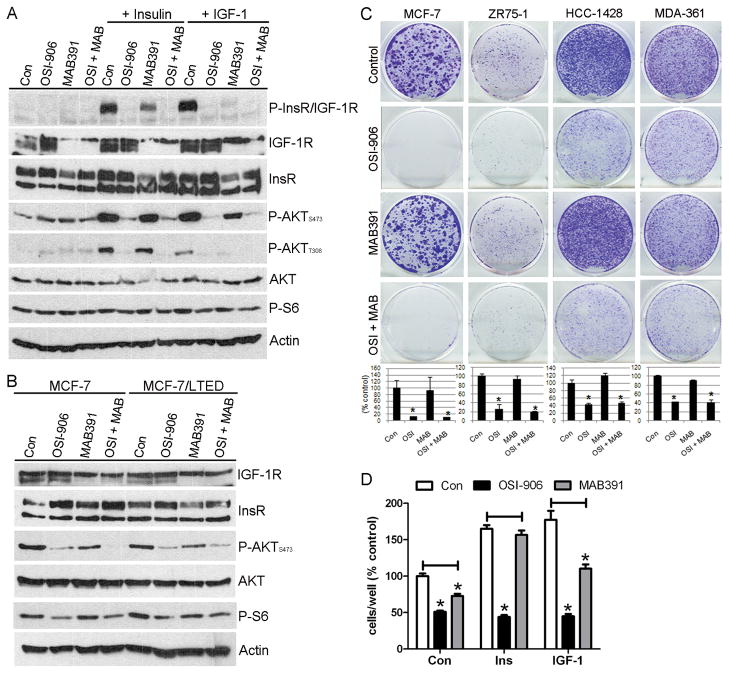
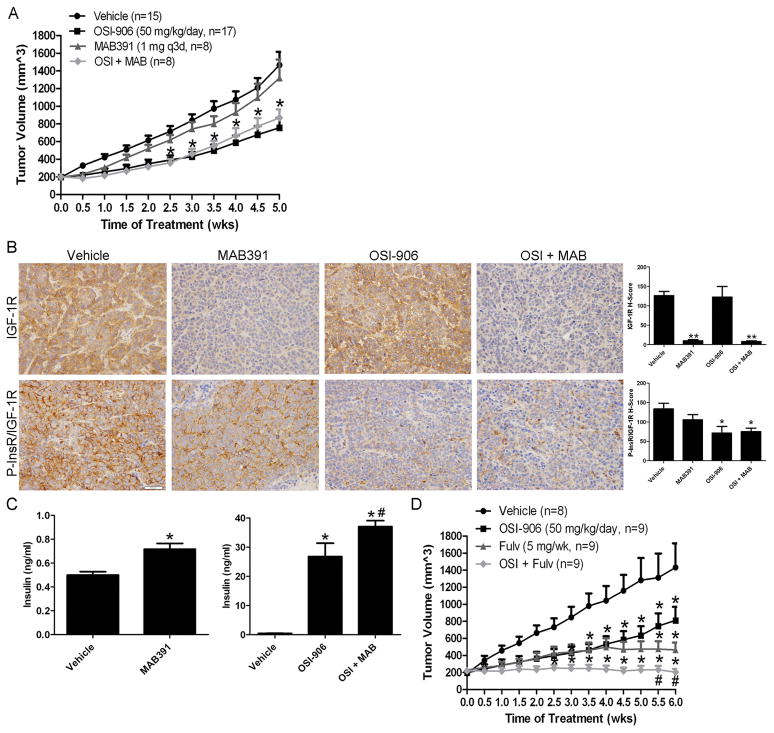
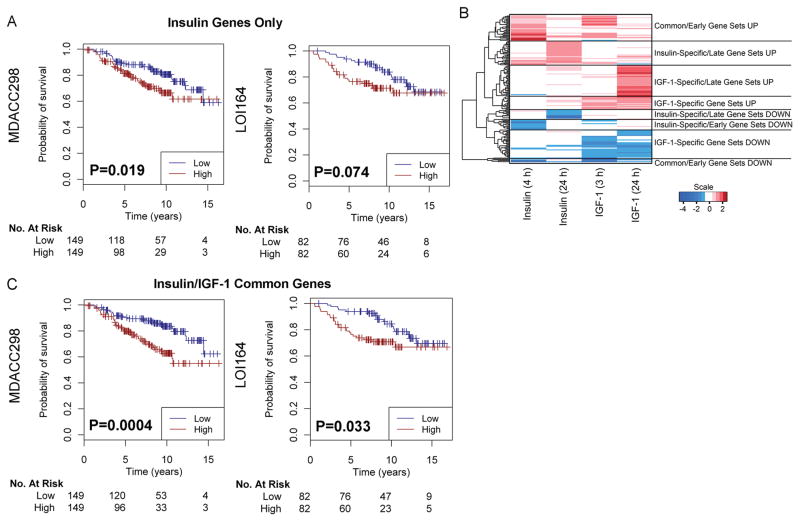
Estrogen receptor α (ER)-positive breast cancers adapt to hormone deprivation and become resistant to antiestrogens. In this study, we sought to identify kinases essential for growth of ER(+) breast cancer cells resistant to long-term estrogen deprivation (LTED). A kinome-wide siRNA screen showed that the insulin receptor (InsR) is required for growth of MCF-7/LTED cells. Knockdown of InsR and/or insulin-like growth factor-I receptor (IGF-IR) inhibited growth of 3 of 4 LTED cell lines. Inhibition of InsR and IGF-IR with the dual tyrosine kinase inhibitor OSI-906 prevented the emergence of hormone-independent cells and tumors in vivo, inhibited parental and LTED cell growth and PI3K/AKT signaling, and suppressed growth of established MCF-7 xenografts in ovariectomized mice, whereas treatment with the neutralizing IGF-IR monoclonal antibody MAB391 was ineffective. Combined treatment with OSI-906 and the ER downregulator fulvestrant more effectively suppressed hormone-independent tumor growth than either drug alone. Finally, an insulin/IGF-I gene expression signature predicted recurrence-free survival in patients with ER(+) breast cancer treated with the antiestrogen tamoxifen. We conclude that therapeutic targeting of both InsR and IGF-IR should be more effective than targeting IGF-IR alone in abrogating resistance to endocrine therapy in breast cancer.
©2011 AACR.
Conflict of interest statement
Figures
Similar articles
-
Autocrine IGF-I/insulin receptor axis compensates for inhibition of AKT in ER-positive breast cancer cells with resistance to estrogen deprivation.Breast Cancer Res. 2013;15(4):R55. doi: 10.1186/bcr3449. Breast Cancer Res. 2013. PMID: 23844554 Free PMC article.
-
Targeting tyrosine-kinases and estrogen receptor abrogates resistance to endocrine therapy in breast cancer.Oncotarget. 2014 Oct 15;5(19):9049-64. doi: 10.18632/oncotarget.2022. Oncotarget. 2014. PMID: 24979294 Free PMC article.
-
Kinome-wide functional screen identifies role of PLK1 in hormone-independent, ER-positive breast cancer.Cancer Res. 2015 Jan 15;75(2):405-14. doi: 10.1158/0008-5472.CAN-14-2475. Epub 2014 Dec 5. Cancer Res. 2015. PMID: 25480943 Free PMC article.
-
Endocrine resistance: what do we know?Am Soc Clin Oncol Educ Book. 2013. doi: 10.14694/EdBook_AM.2013.33.e37. Am Soc Clin Oncol Educ Book. 2013. PMID: 23714450 Review.
-
Aromatase inhibitors: combinations with fulvestrant or signal transduction inhibitors as a strategy to overcome endocrine resistance.J Steroid Biochem Mol Biol. 2005 May;95(1-5):173-81. doi: 10.1016/j.jsbmb.2005.04.004. J Steroid Biochem Mol Biol. 2005. PMID: 15996863 Review.
Cited by
-
Abrogating endocrine resistance by targeting ERα and PI3K in breast cancer.Front Oncol. 2012 Oct 16;2:145. doi: 10.3389/fonc.2012.00145. eCollection 2012. Front Oncol. 2012. PMID: 23087906 Free PMC article.
-
Down-regulation of programmed cell death 4 (PDCD4) is associated with aromatase inhibitor resistance and a poor prognosis in estrogen receptor-positive breast cancer.Breast Cancer Res Treat. 2015 Jul;152(1):29-39. doi: 10.1007/s10549-015-3446-8. Epub 2015 May 31. Breast Cancer Res Treat. 2015. PMID: 26026468 Free PMC article.
-
In vitro breast cancer models for studying mechanisms of resistance to endocrine therapy.Explor Target Antitumor Ther. 2022;3(3):297-320. doi: 10.37349/etat.2022.00084. Epub 2022 Jun 1. Explor Target Antitumor Ther. 2022. PMID: 36045910 Free PMC article. Review.
-
Hormonally responsive breast cancer cells in a microfluidic co-culture model as a sensor of microenvironmental activity.Integr Biol (Camb). 2013 May;5(5):807-16. doi: 10.1039/c3ib20265h. Integr Biol (Camb). 2013. PMID: 23559098 Free PMC article.
-
Fibroblast Subtypes Regulate Responsiveness of Luminal Breast Cancer to Estrogen.Clin Cancer Res. 2017 Apr 1;23(7):1710-1721. doi: 10.1158/1078-0432.CCR-15-2851. Epub 2016 Oct 4. Clin Cancer Res. 2017. PMID: 27702820 Free PMC article.
References
-
- Clayton PE, Banerjee I, Murray PG, Renehan AG. Growth hormone, the insulin-like growth factor axis, insulin and cancer risk. Nat Rev Endocrinol. 2010;7:11–24. - PubMed
-
- Belfiore A, Frasca F. IGF and insulin receptor signaling in breast cancer. J Mammary Gland Biol Neoplasia. 2008;13:381–406. - PubMed
-
- Papa V, Gliozzo B, Clark GM, McGuire WL, Moore D, Fujita-Yamaguchi Y, et al. Insulin-like growth factor-I receptors are overexpressed and predict a low risk in human breast cancer. Cancer Res. 1993;53:3736–40. - PubMed
-
- Pandini G, Vigneri R, Costantino A, Frasca F, Ippolito A, Fujita-Yamaguchi Y, et al. Insulin and insulin-like growth factor-I (IGF-I) receptor overexpression in breast cancers leads to insulin/IGF-I hybrid receptor overexpression: evidence for a second mechanism of IGF-I signaling. Clin Cancer Res. 1999;5:1935–44. - PubMed
Publication types
MeSH terms
Substances
Grants and funding
- R01 CA080195/CA/NCI NIH HHS/United States
- P30 CA016672/CA/NCI NIH HHS/United States
- RC1CA145138/CA/NCI NIH HHS/United States
- R01 CA140628/CA/NCI NIH HHS/United States
- K25 CA127349/CA/NCI NIH HHS/United States
- K99 CA142899/CA/NCI NIH HHS/United States
- U24CA126588/CA/NCI NIH HHS/United States
- U24 CA126588/CA/NCI NIH HHS/United States
- F32 CA121900/CA/NCI NIH HHS/United States
- F32CA121900/CA/NCI NIH HHS/United States
- P50CA98131/CA/NCI NIH HHS/United States
- P30CA68485/CA/NCI NIH HHS/United States
- P50 CA098258/CA/NCI NIH HHS/United States
- K99CA142899/CA/NCI NIH HHS/United States
- K25CA127349/CA/NCI NIH HHS/United States
- RC1 CA145138/CA/NCI NIH HHS/United States
- P50 CA098131/CA/NCI NIH HHS/United States
- R01CA140628/CA/NCI NIH HHS/United States
- P30 CA068485/CA/NCI NIH HHS/United States
- T32 CA009592/CA/NCI NIH HHS/United States
LinkOut - more resources
Full Text Sources
Other Literature Sources
Medical
Molecular Biology Databases
Miscellaneous
