Comparative Study
. 2011 Nov 18;286(46):40266-75.
doi: 10.1074/jbc.M111.265595. Epub 2011 Sep 9.

Collagen VI, conformation of A-domain arrays and microfibril architecture

Affiliations
Comparative Study

Collagen VI, conformation of A-domain arrays and microfibril architecture

Nicola Beecher et al. J Biol Chem. .

Abstract

Collagen VI is a ubiquitous extracellular matrix protein that assembles into beaded microfibrils that form networks linking cells to the matrix. Collagen VI microfibrils are typically formed from a heterotrimer of the α1, α2, and α3 chains. The α3 chain is distinct as it contains an extended N terminus with up to 10 consecutive von Willebrand factor type A-domains (VWA). Here, we use solution small angle x-ray scattering (SAXS) and single particle analysis EM to determine the nanostructure of nine of these contiguous A-domains. Both techniques reveal a tight C-shape conformation for the A-domains. Furthermore, using biophysical approaches, we demonstrate that the N-terminal region undergoes a conformational change and a proportion forms dimers in the presence of Zn(2+). This is the first indication that divalent cations interact with collagen VI A-domains. A three-dimensional reconstruction of tissue-purified collagen VI microfibrils was generated using EM and single particle image analysis. The reconstruction showed the intricate architecture of the collagen VI globular regions, in particular the highly structurally conserved C-terminal region and variations in the appearance of the N-terminal region. The N-terminal domains project out from the globular beaded region like angled radial spokes. These could potentially provide interactive surfaces for other cell matrix molecules.


Figures

FIGURE 1.
FIGURE 1.
Expression and characterization of the human α3(VI) N9-N1 region. A, schematic diagram of the α3(VI) N9-N1 construct. Squares represent the VWA domains. The construct has a C-terminal His10 tag following a thrombin cleavage sequence. B, Coomassie stained SDS-PAGE of the purified N9-N1 region under reducing conditions. Lane 1 is the molecular weight marker, and lane 2 shows the N9-N1 region running as a single band of ∼190 kDa after elution from the nickel-nitrilotriacetic acid column but prior to gel filtration. C, size-exclusion chromatography of the N9-N1 region. The graph shows the absorbance at 280 nm wavelength with volume. The major species elutes from the size exclusion column at 11.5 ml. Au, absorbance units. D, multiangle laser light scattering of the N9-N1 region. The graph shows the differential refractive index and molecular mass with volume. The molecular mass of 203,000 ± 4060 Da (experimental errors from polydispersity) is approximately that expected for a monomer (195,572 Da). E, C(s) analysis of the N9-N1 region as derived from sedimentation velocity AUC.
FIGURE 2.
FIGURE 2.
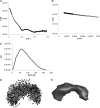
Solution small angle x-ray scattering data for the α3(VI) N9-N1 region. A, the experimental SAXS data for the N9-N1 region are plotted as a function of q. B, the low-angle region of the x-ray scattering data is show in the form of a Guinier plot, which is linear for values q ≤ 1/Rg (black squares). C, the distance distribution function is shown. D, shapes were simulated ab initio by the programs DAMMIN. An example of 10 independent DAMMIN simulations are shown superimposed to highlight the uniqueness of the solution. E, these were used to calculate an average “most probable” shape, which is represented as a solid model.
FIGURE 3.
FIGURE 3.
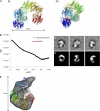
Nanostructure of the α3(VI) N9-N1 region. A, rigid body modeling of nine A-domains was performed to the experimental SAXS data using the program SASREF. A representative model is shown in two orthogonal views (panels i and ii) with the domains shown in a schematic representation and colored blue at the N-terminal domain through to red at the C-terminal domain. B, graph of the fit between the experimental SAXS data and the theoretical x-ray scattering of the rigid body model shown in A. C, low dose negatively stained EM images were recorded on a Tecnai T12 twin at 120 kV using a CCD detector. Individual N9-N1 particles were windowed into 26 × 26 nm boxes. Selected representative class averages from the single particle image processing are shown. D, images of the three-dimensional reconstruction represented as a solid surface are shown. E, an overlay of the EM three-dimensional reconstruction is shown as a mesh, with a rigid body model from the SAXS analysis superimposed.
FIGURE 4.
FIGURE 4.
Interaction with metal ions by the α3(VI) N9-N1 region. A, the change in thickness of the N9-N1 region was measured in the presence of either 500 μm Mg2+, Mn2+, or Zn2+ using the FarField Analight. B, table showing the decrease in thickness of the N9-N1 layer with increasing concentrations of Zn2+. These data are also expressed as a percentage change from the starting thickness. C, C(s) analysis of the N9-N1 region in the absence and presence of 1 mm concentrations of either Mg2+, Mn2+, and Zn2+ as derived from sedimentation velocity AUC. D, multiangle laser light scattering of the N9-N1 region in the presence and absence of Zn2+. The graph shows the differential refractive index (RI) with volume. In the absence of Zn2+ the major species elutes from the size exclusion column at 14 ml, but in the presence of Zn2+, there are two species, a minor one at 13.25 ml and another at 14.75 ml. The molecular mass was plotted for each species.
FIGURE 5.
FIGURE 5.
Extraction and negative staining EM of bovine corneal collagen VI microfibrils. A, electron micrograph image of a field of collagen VI microfibrils stained with uranyl acetate, taken on the FEI Polara at 200 kV, magnification ∼50,000×. The image was recorded on a Gatan Ultrascan 4000 CCD. No image enhancement or other filters have been applied. The arrow indicates a distinctive image that resembles one of the class averages shown in Fig. 6. A filamentous line of density appears to take an external route around the particle. Scale bar, 100 nm. B, Coomassie stained SDS-PAGE of the extracted collagen VI microfibrils under reducing conditions. Lane 1 is the molecular weight marker, and lane 2 shows the three bands seen in the collagen VI preparation. These were identified by MS as the collagen VI α1, α2, and α3 chains and aldehyde dehydrogenase, the major soluble protein in cornea (43). The most abundant α3 chain in these preparations is likely to be N8-N6-C1.
FIGURE 6.
FIGURE 6.
Three-dimensional reconstruction of the half-bead region from collagen VI microfibrils. A, the average of all collagen VI “double-beads,” followed by 23 representative class averages. 23 of 50 class averages are shown, representing 1055 of 2438 images. The box size is 64 × 64 nm. The double-bead has approximate dimensions of ∼15 × 45 nm. The globular intrabead feature is indicated by the arrow in the first frame, this can also be seen in some of the class averages. Conformation variability is apparent in these images; different views of the half-beads and angles between the individual half-beads can be seen. B, panel of nine representative class averages of images from the single particle refinement, the box size is 32 × 32 nm. Images were recorded on FEI Tecnai T12 twin at 120 kV. Some of the views can be recognized in Fig. 5. A full set of class averages and corresponding projections of the structure is shown in supplemental Fig. S3. C, radial distribution of density from a cylindrically averaged structure. The collagen VI half-bead has a layered structural organization. A slice through the center of the radially averaged three-dimensional density (left) when projected to a one-dimensional trace (right) displays a distinctly banded structure. They have been assigned and labeled from the top as bands I (head), II (intermediate), and III and IV (tail regions). These bands measure 5.4, 3.8, 4.8, and 7.0 nm, respectively. The scale on the right is in Angstroms (produced in SPIDER/WEB).
FIGURE 7.
FIGURE 7.
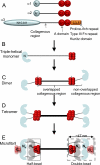
Schematic diagrams showing the assembly of collagen VI. A, domain organization of the three α-chains. Blue and red circles represent N- and C-terminal VWA domains, respectively. B, the α1, α2, and α3 chains assemble to form a triple-helical monomer. C, dimers are formed by the anti-parallel overlapping association of two monomers. The overlapping collagenous region is represented as a solid line, whereas the non-overlapping collagenous regions are shown as dotted lines. D, tetramers are formed by the parallel association of two dimers. E, microfibrils are formed by end-to-end interaction of tetramers. Globular regions from one tetramer are labeled Na (blue), Ca (red), and from overlapping tetramers Nb, Nc (gray), Cb, and Cc (pink). The overlapping collagenous region is represented as a solid line, whereas the non-overlapping collagenous regions are shown as dotted lines. The beaded region boxed out for EM analysis has been indicated (modified from Ref. 6).
FIGURE 8.
FIGURE 8.
Modeling VWA domains into the half-bead structure. A, external views of the three-dimensional map are shown in two different orientations (panels i and ii). The surface is colored along the microfibril axis, red (head) to blue (tail), corresponding to assignment of the C and N termini of collagen VI (see text for explanation). B, cut open view of the three-dimensional map colored by relative density of the three-dimensional map. The color key indicates increasing density from blue to red. Maps are rendered with UCSF Chimera. C, three-dimensional map of the half-bead with six VWA domains fitted to the head part of the structure. Panel i, six VWA domains, representing the C1 domains from two triple-helical monomers, were docked into the three-dimensional map of the half-bead. Panels ii and iii, cut open views of the three-dimensional map showing three A-domains fitted in each half. Docking was performed with UCSF Chimera, and the map was also rendered with UCSF Chimera. B and C show the hollow center of the head layer.

References

    1. Gara S. K., Grumati P., Urciuolo A., Bonaldo P., Kobbe B., Koch M., Paulsson M., Wagener R. (2008) J. Biol. Chem. 283, 10658–10670 - PubMed
    1. Fitzgerald J., Rich C., Zhou F. H., Hansen U. (2008) J. Biol. Chem. 283, 20170–20180 - PubMed
    1. Lampe A. K., Bushby K. M. (2005) J. Med. Genet. 42, 673–685 - PMC - PubMed
    1. Baker N. L., Mörgelin M., Peat R., Goemans N., North K. N., Bateman J. F., Lamandé S. R. (2005) Hum. Mol. Genet. 14, 279–293 - PubMed
    1. Furthmayr H., Wiedemann H., Timpl R., Odermatt E., Engel J. (1983) Biochem. J. 211, 303–311 - PMC - PubMed

Publication types

Substances

LinkOut - more resources