. 2011 Sep 9;30(22):4652-64.
doi: 10.1038/emboj.2011.324.

Arrangement of electron transport chain components in bovine mitochondrial supercomplex I1III2IV1

Affiliations

Arrangement of electron transport chain components in bovine mitochondrial supercomplex I1III2IV1

Thorsten Althoff et al. EMBO J. .

Abstract

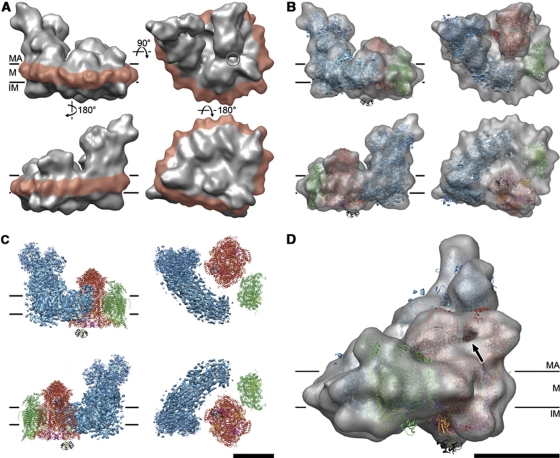
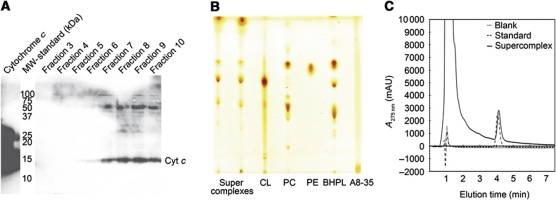
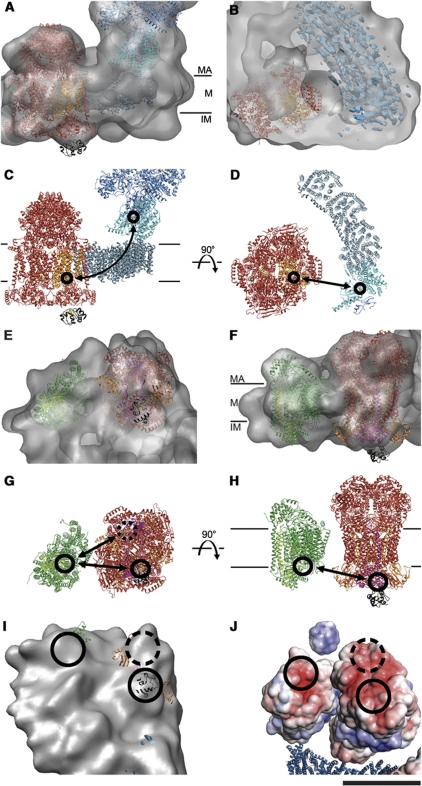
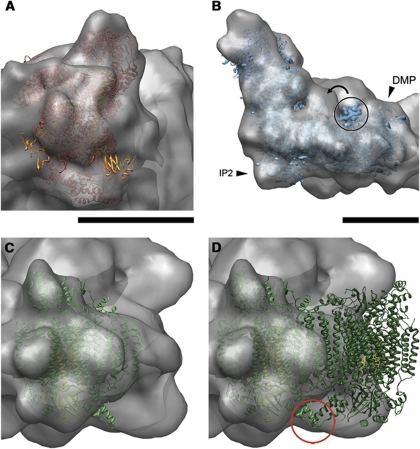
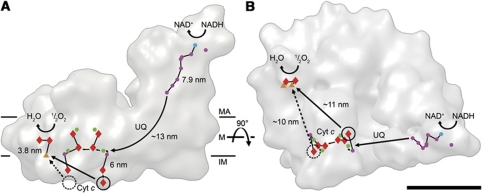
The respiratory chain in the inner mitochondrial membrane contains three large multi-enzyme complexes that together establish the proton gradient for ATP synthesis, and assemble into a supercomplex. A 19-Å 3D map of the 1.7-MDa amphipol-solubilized supercomplex I(1)III(2)IV(1) from bovine heart obtained by single-particle electron cryo-microscopy reveals an amphipol belt replacing the membrane lipid bilayer. A precise fit of the X-ray structures of complex I, the complex III dimer, and monomeric complex IV indicates distances of 13 nm between the ubiquinol-binding sites of complexes I and III, and of 10-11 nm between the cytochrome c binding sites of complexes III and IV. The arrangement of respiratory chain complexes suggests two possible pathways for efficient electron transfer through the supercomplex, of which the shorter branch through the complex III monomer proximal to complex I may be preferred.


Conflict of interest statement

J-LP holds patents on amphipols and their use. All other authors declare that they have no conflict of interest.

Figures

Figure 1
Figure 1
Purification of active mitochondrial supercomplexes in amphipol A8-35. (A) Digitonin-solubilized mitochondria were incubated with amphipols (A) and γ-cyclodextrin (γ-CD) and the soluble fraction was analysed on 3–10% BN-PAGE. Proteins were stained with NBT for complex I activity. Supercomplexes solubilized with digitonin (B, D) or amphipols (C, E) were separated in linear density gradients. Fractions were collected from bottom to top and analysed by 3–10% BN-PAGE. NBT staining shows complex I activity (A, B); DAB staining shows complex IV activity (D, E). The blue colour is due to Coomassie stain from BN-PAGE.
Figure 2
Figure 2
Cryo-EM and single-particle analysis. Amphipol-solubilized supercomplexes in vitrified buffer on continuous carbon support film recorded at a tilt angle of −45° (A) or 0° (B). Scale bar, 100 nm. (C) 5 out of 150 selected class averages of untilted images filtered to 50 Å after the final round of multi-reference alignment and MSA classification (class number in upper left corner, number of particles in lower right corner). (D) Reprojections of the final 19-Å reconstruction corresponding to the class averages shown in (C).
Figure 3
Figure 3
Slices through the X-ray structures fitted to the supercomplex map at two different contour levels. X-ray structures of complex I (blue), complex IV (green), complex III (red, with Rieske proteins in orange and c1 in purple), and cytochrome c (black) fitted to the cryo-EM map, drawn at 1.3 σ (light grey) and 4.3 σ (dark grey). (A) Side view along the membrane, showing the position of consecutive 2.2-nm slices in (BL), starting from the matrix side. Shortest distances (in nm) between complexes are shown in red and distances <1.5 nm are marked with red circles. Scale bar, 10 nm.
Figure 4
Figure 4
3D map and fitted X-ray structures. (A) Cryo-EM 3D map as seen from two opposite sides (left), from the matrix (top right), and the intermembrane space (lower right). The amphipol belt is shown in red. The circle marks the gap between complex I and complex III. (B) X-ray structures of component complexes (blue, complex I; red, complex III; green, complex IV) and cytochrome c (black) fitted to the 3D cryo-EM map. (C) Docked X-ray structures without map. (D) Enlarged view with docked X-ray structures. Rieske domains are orange. The arrow points to the gap between the matrix domains of complex III used for positioning the X-ray structure. MA, matrix; M, membrane; IM, intermembrane space. Scale bars, 10 nm.
Figure 5
Figure 5
The supercomplex contains cytochrome c, ubiquinol, and cardiolipin. (A) Western blot showing the presence of cytochrome c in the supercomplex. Amphipol-solubilized supercomplex was purified by density gradient centrifugation and fractions were analysed by 15% SDS–PAGE and western blot with an anti-cytochrome c antibody. Cytochrome c runs at ∼15 kDa. (B) Lipid extracts from two different supercomplex preparations (lanes 1 and 2) and purified lipid standards (lanes 3–5). The supercomplex contains phosphatidyl choline (PC), phosphatidyl ethanolamine (PE), and cardiolipin (CL), which is enriched compared with bovine heart polar lipid extract (BHPL, lane 6). (C) Ubiquinol was quantified by HPLC and comparison to Q10 standards. Each supercomplex contains at least 1 molecule of ubiquinol.
Figure 6
Figure 6
Substrate binding sites. X-ray structures of complex I (blue ribbon model and electron density as in Figure 3 and 4), bovine complex III (red), IV (green), and cytochrome c (black) docked into the supercomplex map. Ubiquinol-binding sites are located between the 49-kDa and the PSST subunits near the first FeS-cluster above the membrane in complex I and the cytochrome b subunit in complex III (orange). Views from the membrane (A, C) and from the matrix side (B, D) with and without map. Cytochrome c binding sites are located on the intermembrane side below the c1 subunit of complex III (purple) and near two Cu atoms (circle) in subunit II of complex IV (light green). View from the intermembrane space (E, G) and side views (F, H), with and without map. Cytochrome c binding sites are circled and the shortest cytochrome c trajectories are marked with arrows. Dashed circles mark the unoccupied distal cytochrome c binding site. Surface of the supercomplex (I) and surface charge distribution (J) on the intermembrane side of complexes III and IV (red, negative; blue, positive; white, neutral). For comparison, the positively charged surface of cytochrome c is shown above. The blue ribbon diagram shows part of the complex I membrane arm for orientation. MA, matrix; M, membrane; IM, intermembrane space. Scale bar, 10 nm.
Figure 7
Figure 7
Conformational changes. (A) Both Rieske domains (orange) of bovine complex III protrude from the cryo-EM map. (B) View with fitted complex I (ribbon model of bacterial complexes and 6-Å electron density of Y. lipolytica 6-complex I). Arrowheads point to the DMP and IP2 domains, which are absent in the bacterial complex. The circle marks the PMP, which is also absent in the bacterial complex and appears to have moved from its position in the X-ray structure (curved arrow). Fit of bovine complex IV monomer (C) and dimer (D). A helix of subunit VIb, which forms part of the dimer interface in the crystal structure, protrudes from the cryo-EM map (red circle). Scale bars, 10 nm.
Figure 8
Figure 8
Electron transfer pathways in the supercomplex. Outline of the supercomplex with cofactors active in electron transport marked in blue (FMN), purple (iron–sulphur-clusters), green (quinols/stigmatellins), red (hemes), and orange (copper atoms), seen from the membrane (A) and from the matrix (B). Electron trajectories are marked in black. The dashed circle marks the distal cytochrome c binding site, which is unoccupied in the supercomplex. Straight arrows in A indicate the shortest distances from the cytochrome c binding sites on complex III to the site of cytochrome c oxidation in complex IV. The shorter, proximal branch may be preferred for electron transport. MA, matrix; M, membrane; IM, intermembrane space; UQ, ubiquinol; Cyt c, cytochrome c. Scale bar, 10 nm.

References

    1. Acin-Perez R, Fernandez-Silva P, Peleato ML, Perez-Martos A, Enriquez JA (2008) Respiratory active mitochondrial supercomplexes. Mol Cell 32: 529–539 - PubMed
    1. Baker NA, Sept D, Joseph S, Holst MJ, McCammon JA (2001) Electrostatics of nanosystems: application to microtubules and the ribosome. Proc Natl Acad Sci USA 98: 10037–10041 - PMC - PubMed
    1. Ben-Shem A, Frolow F, Nelson N (2003) Crystal structure of plant photosystem I. Nature 426: 630–635 - PubMed
    1. Castellani M, Covian R, Kleinschroth T, Anderka O, Ludwig B, Trumpower BL (2010) Direct demonstration of half-of-the-sites reactivity in the dimeric cytochrome bc1 complex: enzyme with one inactive monomer is fully active but unable to activate the second ubiquinol oxidation site in response to ligand binding at the ubiquinone reduction site. J Biol Chem 285: 502–510 - PMC - PubMed
    1. Chance B, Williams GR (1955) Respiratory enzymes in oxidative phosphorylation. III. The steady state. J Biol Chem 217: 409–427 - PubMed

Publication types

MeSH terms

Substances

Associated data