. 2011 Sep 11;14(10):1317-22.
doi: 10.1038/nn.2906.

Coordinated dynamic encoding in the retina using opposing forms of plasticity

Affiliations

Coordinated dynamic encoding in the retina using opposing forms of plasticity

David B Kastner et al. Nat Neurosci. .

Abstract

The range of natural inputs encoded by a neuron often exceeds its dynamic range. To overcome this limitation, neural populations divide their inputs among different cell classes, as with rod and cone photoreceptors, and adapt by shifting their dynamic range. We report that the dynamic behavior of retinal ganglion cells in salamanders, mice and rabbits is divided into two opposing forms of short-term plasticity in different cell classes. One population of cells exhibited sensitization-a persistent elevated sensitivity following a strong stimulus. This newly observed dynamic behavior compensates for the information loss caused by the known process of adaptation occurring in a separate cell population. The two populations divide the dynamic range of inputs, with sensitizing cells encoding weak signals and adapting cells encoding strong signals. In the two populations, the linear, threshold and adaptive properties are linked to preserve responsiveness when stimulus statistics change, with one population maintaining the ability to respond when the other fails.


Figures

Figure 1
Figure 1
Adaptation and sensitization in separate neural populations. (a) Stimulus intensity alternating between high and low contrast during a single trial (top), for salamander (left) and mouse (right). Firing rate response for adapting (middle) and sensitizing (bottom) cells, averaged over all trials, each with a different stimulus sequence. Color indicates response to low contrast. (b) Average time to first spike after a transition from high to low contrast (n = 2 – 12 cells). (c) Nonlinearities of an LN model (see methods) for cells in (a) calculated during intervals indicated by bars in (a) for salamander (left) and mouse (right). The interval Learly was defined as 0.5 – 2 s after the transition to low contrast, and Llate was 10 – 16 s for salamander and 10 – 15 s for mouse. (d) Adaptive indices (see methods) for 190 ganglion cells from 16 salamander retinas. The distribution is significantly bimodal (Hartigan's dip test, P < 0.05). (e) High contrast (35 %) was presented for 1, 2 or 5 s, followed by low contrast (3 %) for 15 s. The average change in firing rate between Learly and Llate is shown normalized by the average rate for low contrast in all conditions (n = 5 cells). Black line is an exponential fit to the data. (f) For the same cells, the adaptive index was computed separately for changing contrast at a fixed luminance, and compared to the adaptive index when changing the mean luminance a factor of 16 at a fixed contrast of 10 % (see Supplementary Fig. 4).
Figure 2
Figure 2
Sensitizing and adapting populations encode common stimulus features. (a) Average response of salamander adapting and sensitizing cells to 26 trials of the same stimulus repeated during Learly and Llate after 4 s of high contrast (35%). Low contrast was 3–5 %. Firing rate binned at 10 ms. (b) Absolute difference in time between events in all pairs of fast Off-type adapting cells (n = 28) and sensitizing cells (n = 12). Events defined as times when a cell's firing rate, binned at 10 ms, exceeded 20 Hz. (c) Average temporal (top) and spatial (bottom) filters for adapting (n = 142), and sensitizing (n = 48) fast Off cells, mapped in one dimension. Curves obscure the error bars located at the peak and trough of the temporal filters and along the spatial filters. Spatial filters normalized to their peaks. (d) Fractions of adapting and sensitizing cells of different cell types, as classified by a cell's temporal filter (n = 209 fast Off, 16 medium Off, 20 slow Off, 9 On) (Supplementary Fig. 10). (e) Spatial receptive field centers of fast Off adapting and sensitizing cells recorded simultaneously. Receptive fields displayed at one standard deviation of a 2-D Gaussian fit. (f) Histogram of spacing (see methods) between nearest neighbors of fast Off adapting (n = 615) and sensitizing cells (n = 171).
Figure 3
Figure 3
Improvement of discriminability in a combined population of sensitizing and adapting cells. (a) Nonlinearities for adapting (n = 21) and sensitizing (n = 13) cells during Learly (left) and Llate (right). (b) Discriminability between nearby stimuli d'(g) as a function of the stimulus (see methods) in the full population minus d'(g) for the adapting population alone (blue) or minus d'(g) for the sensitizing population alone (red) during Learly (left) and Llate (right). All values were normalized by the area of the total d' in the full population during Llate.
Figure 4
Figure 4
Sensitizing cells specialize to encode weak signals; adapting cells encode strong signals. (a) Twelve different contrast levels (3 – 36 %) were randomly interleaved for at least 110 s and three repeats, and the first 10 s of data in each contrast was discarded. Nonlinearities are shown for an adapting (top) and sensitizing (bottom) cell for the different contrasts. Each row is a different nonlinearity, displayed in a color scale. Black dots indicate one standard deviation above the mean for each contrast level. Nonlinearities calculated from the data (left), and as predicted using a model described in panel (c) (right). (b) Normalized nonlinearities from cells in panel (a). For each contrast, the nonlinearity was scaled along the abscissa by the input standard deviation (top) or shifted by a common factor (α) and then scaled along the abscissa by the contrast (bottom). (c) Model Mα. Input values were passed through a threshold function, which shifted the mean value by a factor, α, then were rescaled by the contrast (σ), and then passed through a secondary nonlinearity with threshold θ to recreate the range of nonlinearities shown in (a). The secondary nonlinearity is the average nonlinearity for a cell after shifting by α and rescaling. (d) Nonlinearities Ni (g) were computed for each 3 s bin. For each bin, an estimate of the contrast was determined as the contrast σ for which the steady-state nonlinearity of the model Mα (σ) had the smallest mean-squared difference to Ni (g). Low contrast (5 %) followed 40 s of high contrast (35 %).
Figure 5
Figure 5
Sensitizing and adapting cells increase information transmission using opposing changes in firing rate. (a) Stimulus used in the calculation of mutual information and the stimulus specific information (SSI) for low contrast. 20 s of identical high contrast pulses were followed by Learly, which was 2 s of 8 randomly presented low contrast pulses. For Llate, every 180 s, 44s seconds of continuous, randomly organized, low contrast pulses was presented. (b) Mutual information during Llate versus Learly. Llate occurred from 22 – 44 s after high contrast, and Learly occurred from 0.5 – 2 s after high contrast. All sensitizing cells had a higher firing rate during Learly than Llate (Supplementary Fig. 9a). A bin size of 150 ms was used, but the increase of information during low contrast is independent of bin size (Supplementary Fig. 9b). (c) Average mean and variance during Learly (lighter colors, thicker lines) and Llate (darker colors, thinner lines) for the sensitizing cells in (b), shown as a function of the stimulus pulse amplitude. d) Stimulus specific information ISSI for each of the 8 different low contrast stimuli. In (c) and (d), flash amplitude is the Michelson contrast, (ImaxImin)/(Imax + Imin), of the 8 brief flashes in the low contrast stimulus.
Figure 6
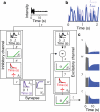
Figure 6
Model of sensitization. (a) Sensitization results from the difference between two adapting pathways, one excitatory and one inhibitory. In each pathway, the stimulus is passed through a linear filter, L, a threshold, N, and then an adapting block, A. The adapting block is a feedforward module. In the inhibitory pathway, the input u(t) is convolved with an exponential filter, FA yielding FA * u (see methods). The input u(t) is then divided by the filtered input FA * u, such that the output of the adapting block v(t) has a smaller amplitude than the input u(t). A temporal filter, LQ, and saturating function, NQ, is applied to the inhibitory pathway before the two pathways are combined. (b) Response of the model to an input that repeated, and was identical during Learly and Llate. (c) Average responses over many white noise sequences, shown at different stages in the model. (v) In the inhibitory pathway, the response decreases during high contrast, and recovers during low contrast. (w) The synaptic functions decrease the response modulation during high contrast. (y) The decrease in inhibition at the transition to low contrast elevates activity in the excitatory pathway. (z) The final adapting block, AE, in the excitatory pathway yields adaptation during high contrast, and preserves sensitization during low contrast.

References

    1. Laughlin S. A simple coding procedure enhances a neuron's information capacity. Z Naturforsch, C, Biosci. 1981;36:910–912. - PubMed
    1. DeWeese M, Zador A. Asymmetric dynamics in optimal variance adaptation. Neural Computation. 1998;10:1179–1202.
    1. Wark B, Fairhall A, Rieke F. Timescales of inference in visual adaptation. Neuron. 2009;61:750–761. - PMC - PubMed
    1. Fairhall AL, Lewen GD, Bialek W, de Ruyter van Steveninck RR. Efficiency and ambiguity in an adaptive neural code. Nature. 2001;412:787–792. - PubMed
    1. Nagel KI, Doupe AJ. Temporal processing and adaptation in the songbird auditory forebrain. Neuron. 2006;51:845–859. - PubMed

Publication types