. 2011 Sep 11;18(10):1094-101.
doi: 10.1038/nsmb.2129.

Competition between ADAR and RNAi pathways for an extensive class of RNA targets

Affiliations

Competition between ADAR and RNAi pathways for an extensive class of RNA targets

Diane Wu et al. Nat Struct Mol Biol. .

Abstract

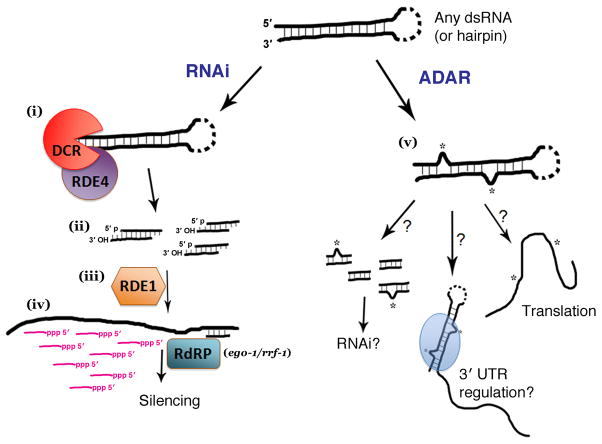
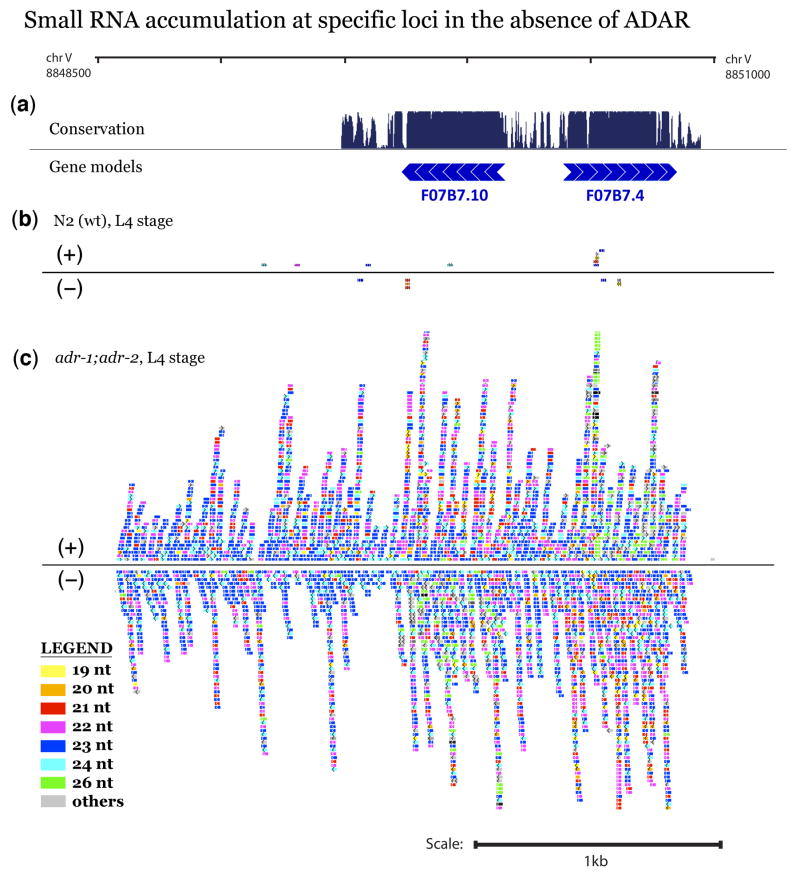
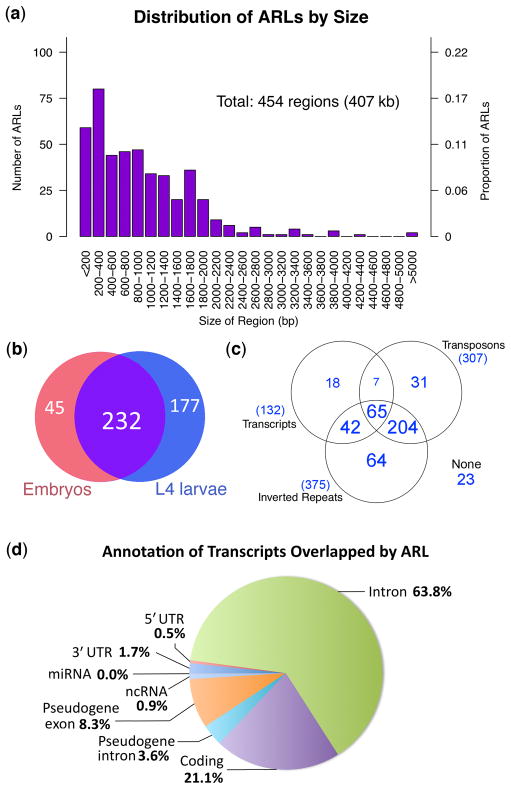
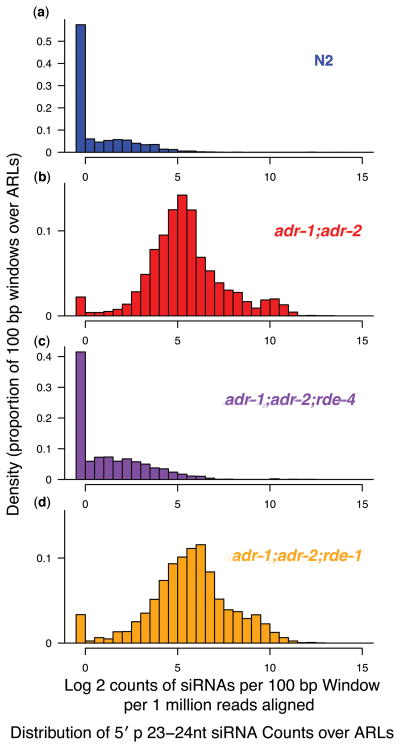
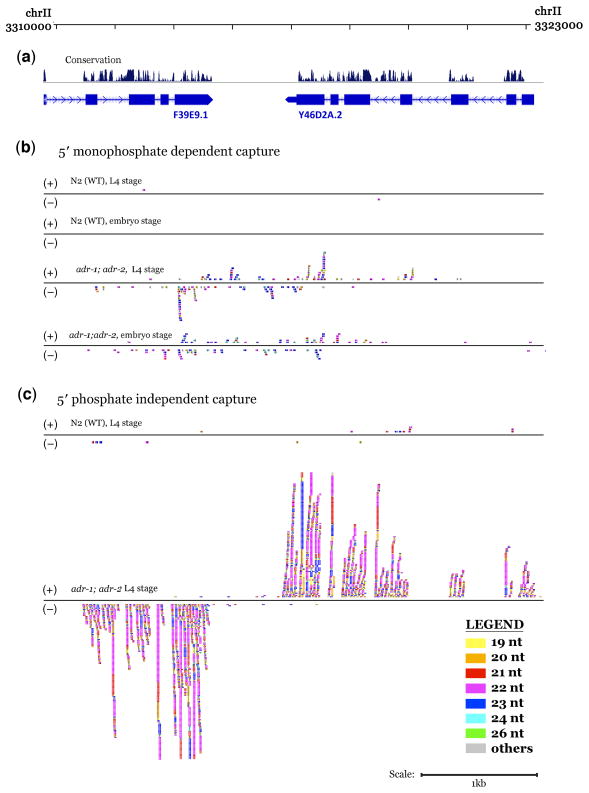
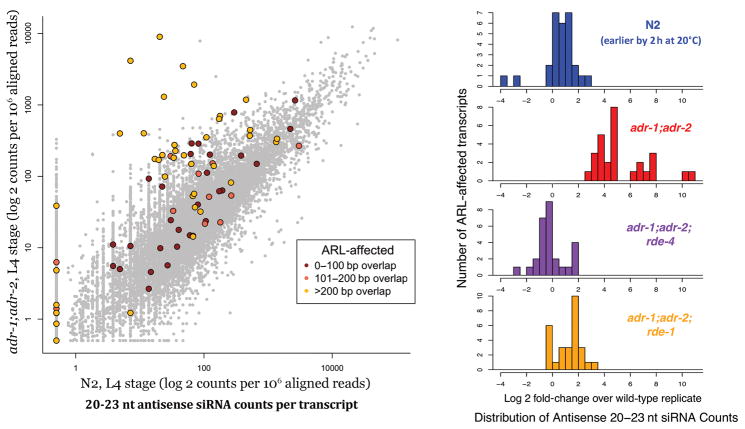
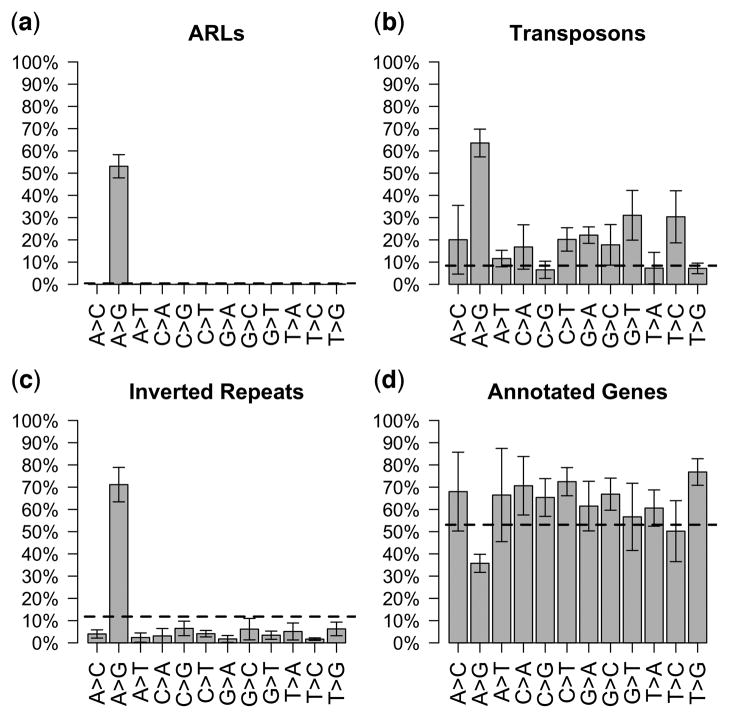
Adenosine deaminases that act on RNAs (ADARs) interact with double-stranded RNAs, deaminating adenosines to inosines. Previous studies of Caenorhabditis elegans indicated an antagonistic interaction between ADAR and RNAi machineries, with ADAR defects suppressed upon additional knockout of RNAi. This suggests a pool of common RNA substrates capable of engaging both pathways. To define and characterize such substrates, we examined small RNA and mRNA populations of ADAR mutants and identified a distinct set of loci from which RNAi-dependent short RNAs are markedly upregulated. At these same loci, we observed populations of multiply edited transcripts, supporting a specific role for ADARs in preventing access to the RNAi pathway for an extensive population of dsRNAs. Characterization of these loci revealed a substantial overlap with noncoding and intergenic regions, suggesting that the landscape of ADAR targets may extend beyond previously annotated classes of transcripts.


Figures

Figure 1
Figure 1. Diverse consequences of dsRNA formation
Figure shows an arbitrary dsRNA (or hairpin) with a number of possible downstream processes. Left: RNA interference (RNAi). In the current model of RNAi, RDE-4 is involved in the recruitment of DCR-1 following recognition of a double-stranded RNAi trigger, resulting in its cleavage (i). (ii) siRNA duplexes produced by Dicer have characteristic structure with 5′ monophosphate, 3′ hydroxyl RNA termini for each strand, and a 2 nt 3′ overhang in the duplex. (iii) These cleaved duplexes subsequently program the Argonaute factor RDE-1 to recognize cognate mRNAs. (iv) Following RDE-1 interaction, target mRNAs serve as templates for the transcription of a pool of “secondary” siRNAs (short antisense transcripts templated from targeted mRNAs that carry a 5′ triphosphate terminus). Secondary siRNAs (shown in magenta) are produced by one of two cellular RNA-directed RNA polymerase (RdRP) enzymes, rrf-1 (somatic tissue) and ego-1 (germline). The RNAi process results in efficient and rapid loss of the pool of cognate mRNAs. (v) ADARs also target double-stranded RNA in vivo, converting a subset of adenines to inosine by deamination and resulting in the unwinding of the dsRNA or in other potential consequences including alterations in mRNA stability, localization, translation, and engagement in other RNA-based machineries such as RNAi,. Genetic evidence in C. elegans suggests that ADAR and RNAi pathways compete for a population of substrates.
Figure 2
Figure 2. Small RNA accumulation at the F07B7 histone locus in the absence of ADAR activity
An exemplary region spanning 2.6 kb (overlapping the F07B7.10 and F07B7.4 regions of C. elegans chromosome V) is shown. (a) Identified coding regions and conservation are diagrammed as UCSC Genome Browser tracks (C. elegans genome version WS190)59. F07B7.10 encodes an H2A histone; F07B7.4 encodes an H2B histone. Direction of transcription is depicted by arrows. (b–c) Small RNAs mapping to this region from (b) N2 and (c) adr-1;adr-2 animals. Each colored rectangle represents up to 10 instances of a distinct small RNA sequence per five million sequenced sRNAs. Small RNAs aligning to the (+) strand are drawn above the line and those aligning to the (−) strand are drawn below the line. Overall numbers of aligned reads for the wild type and adr mutant datasets in this example were 9.2 million and 10.1 million, respectively, (Supplementary Table 1) with comparable representation of miRNAs, 21-U RNAs, and endo siRNAs in the two samples. Additional examples of small RNA coverage are shown in Supplementary Figure 4. Colors indicate sizes (as on figure legend): yellow=19 nt, orange=20 nt, red=21 nt, magenta=22 nt, blue=23 nt, cyan=24 nt, green=26 nt, grey=all other lengths.
Figure 3
Figure 3. Characteristics of ADAR-modulated-RNA-Loci (ARLs)
(a) Histogram showing the distribution of sizes of ARLs. ARLs ranging from 100 bp to 9 kb were detected. (b) Venn diagram showing overlap between ARLs detected at embryo and L4 stages, based on sRNA enrichment (p<0.05) of adr-1;adr-2 animals over wild type levels at embryo and L4 larval stages, respectively. Most ARLs are represented at both stages. (cd) Overlap between ARLs and genomic repeats and features. (c) 82% of detected ARLs overlap annotated inverted repeats, while 67% overlap transposons. Fewer ARLs (18) overlap transcripts alone. A few ARLs (23) do not overlap any annotation assayed. (d) Partitioning of ARL annotations among annotated transcripts. Each ARL is divided into 100 bp segments, which are then indexed to the annotated genome59. Overlaps with 5′ UTR, coding, 3′ UTR, introns, miRNA, and pseudogenes are then tallied, with segments overlapping two or more different annotation categories being split between the relevant classes.
Figure 4
Figure 4
Dependence of ARL sRNAs on the RNAi machinery. Distribution of small RNA abundances (23–24 nt only) for all 100 bp windows contained in ARLs. Small RNA values are shown as counts per million total reads aligned. Counts for each small RNA alignment was normalized to the total number of distinct genomic alignments of the associated sequence read. Distribution of small RNA counts over ARLs were calculated for each of (a) N2 (blue), (b) adr-1;adr-2 (red), (c) adr-1;adr-2;rde-4 (purple), and (d) adr-1;adr-2; rde-1 (orange). Graphs in this figure aggregate L4 and embryo data (individual distributions for L4 and embryo comparisons show a comparable difference; data not shown). Regions with high sRNA counts in wild-type also have comparable levels in adr-1;adr-2 animals, as is evident when small RNA abundances for each 100 bp region are normalized to wild-type levels (Supplementary Fig. 2c).
Figure 5
Figure 5
A substantial class of additional ARL-associated siRNAs are evident in 5′ phosphate independent capture and sequencing. (a) UCSC Genome Browser map (C. elegans genome version WS190) displaying an ARL in the intergenic region between genes F39E9.1 (split into F39E9.1 and F39E9.22 in WS215) and Y46D2A.2 (split into Y46D2A.2 and Y46D2A.5 in WS215), overlapping the last exon of both genes. Direction of transcription is depicted by arrows. (b) Populations of 5′ phosphorylated small RNAs. A substantial increase in small RNA accumulation in adr-1;adr-2 animals over wild-type levels can be seen at both the embryo and L4 stages. (c) Populations of small RNAs that have been exposed at the 5′ end by sequential treatment with alkaline phosphatase followed by polynucleotide kinase. Small RNAs accumulate (with size preference for 21–22 nt and a distinct strand preference) in adr-1;adr-2 animals over wild-type levels at both transcribed loci overlapping the ARL.
Figure 6
Figure 6. Accumulation of a second population of siRNAs in cis to ARLs
(a) Genome-wide characterization of antisense siRNAs isolated using a 5′ phosphate independent capture protocol. Secondary siRNAs (antisense, 20–23nt) were tallied over each transcript. Transcripts overlapping ARLs are colored in dark red, orange, and yellow, based on the size of the total overlap (one, two, or three or more 100 bp segments, respectively). Genes that overlapped ARLs by at least three 100 bp segments and that exhibited a minimum 6-fold increase of secondary siRNAs in adr-1;adr-2 samples were deemed “ARL-affected transcripts”, and were considered as potential beneficiaries of ADAR-RNAi competition (without ADAR, they would be subject to populations of siRNAs produced by the RNAi machinery). (b) Effects of RNAi mutants on the secondary siRNA levels of ARL-affected transcripts. Antisense siRNA counts for ARL-affected transcripts were normalized to their respective wild-type levels. The top row (blue) denotes a separate biological preparation of wild-type animals at an earlier L4 stage (2 h earlier at 20°C). Secondary siRNA levels return to wild-type levels in adr-1;adr-2;rde-4 and adr-1;adr-2;rde-1 triple mutants. Gene-by-gene comparisons of expression-changes between different mutant backgrounds are depicted in Supplementary Figure 5.
Figure 7
Figure 7. A-to-G changes in mRNA exhibit unique and significant enrichment for ARL, inverted repeat, and transposon regions
Nucleotide changes were assayed using RNA-Seq data from both wild-type and adr-1;adr-2 animals, using a stringent set of criteria for candidate editing sites. Sites that matched these criteria and that were absent in the adr-1;adr-2 sample were reported as putative ADAR editing events. In addition to the RNA-Seq analysis of embryo and L4 animals described herein, a wild-type RNA-Seq dataset from L4 larvae prepared in an independent study was used as a replicate. Distribution of genomic annotations for each class of editing event reveal that A-to-G edits are enriched for (a) ADAR-modulated RNA loci as defined from small RNA sequences, (b) Transposon regions, and (c) regions with inverted repeat structure, but not for annotated transcribed regions (d). Dotted lines indicate the fraction of editing events expected to overlap each annotation based on a random distribution across the genome (calculated using a Monte Carlo simulation as described in Methods). Error bars denote one s.d. No other class of editing events detected show similar enrichment patterns. Within ARLs, the distribution of annotations overlapped by A-to-G editing sites is consistent: 89% of edits fall in transposon regions and 78% fall in inverted repeats (data not shown). Note that the distributions over separate annotations are not mutually exclusive (i.e. an editing site may overlap both a transposon and an inverted repeat).

References

    1. Werry TD, Loiacono R, Sexton PM, Christopoulos A. RNA editing of the serotonin 5HT2C receptor and its effects on cell signalling, pharmacology and brain function. Pharmacol Ther. 2008;119:7–23. - PubMed
    1. Nicholas A, et al. Age-related gene-specific changes of A-to-I mRNA editing in the human brain. Mech Ageing Dev. 2010;131:445–7. - PMC - PubMed
    1. Burns CM, et al. Regulation of serotonin-2C receptor G-protein coupling by RNA editing. Nature. 1997;387:303–308. - PubMed
    1. Higuchi M, et al. Point mutation in an AMPA receptor gene rescues lethality in mice deficient in the RNA-editing enzyme ADAR2. Nature. 2000;406:78–81. - PubMed
    1. Rula EY, Emeson RB. Mouse models to elucidate the functional roles of adenosine-to-inosine editing. Meth Enzymol. 2007;424:333–367. - PubMed

Publication types