. 2011 Sep 11;17(10):1269-74.
doi: 10.1038/nm.2453.

Glutamate release by primary brain tumors induces epileptic activity

Affiliations

Glutamate release by primary brain tumors induces epileptic activity

Susan C Buckingham et al. Nat Med. .

Abstract

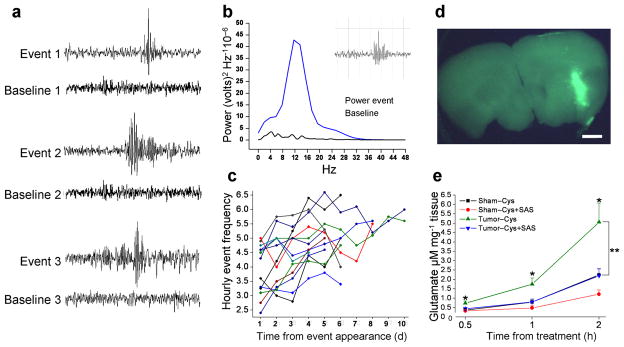
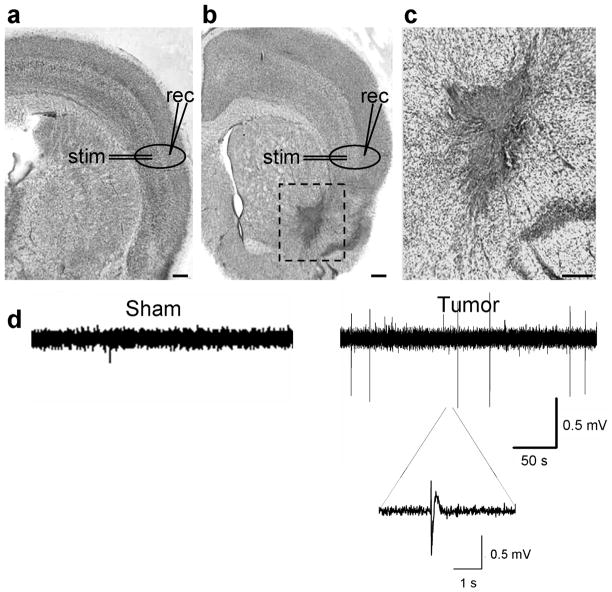
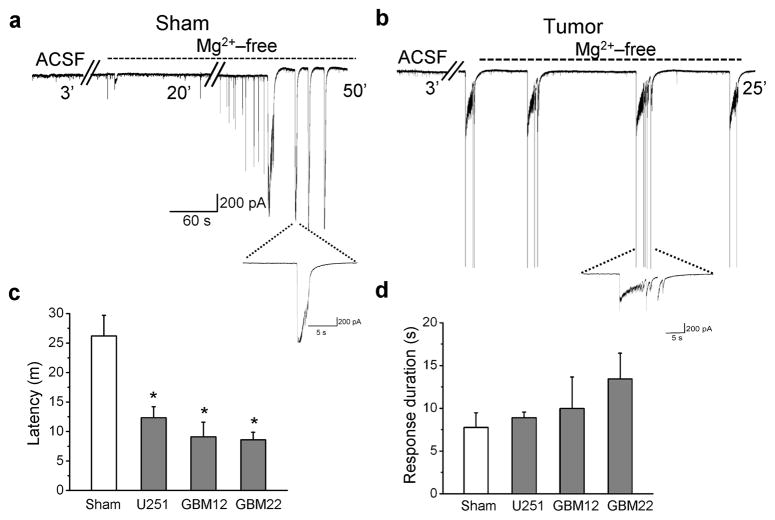
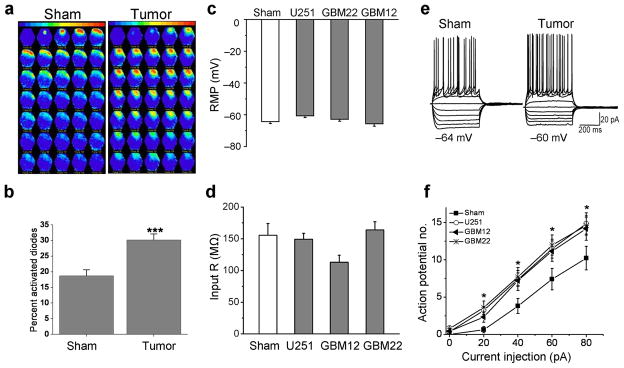
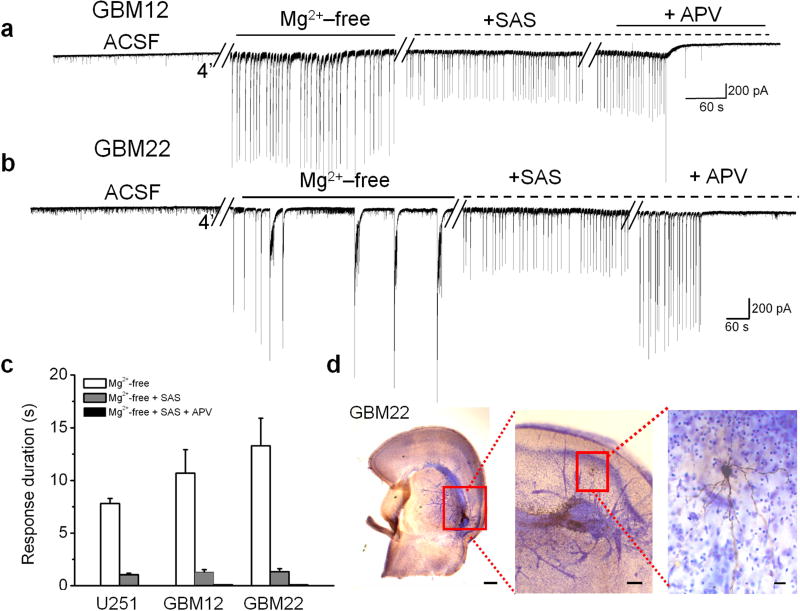
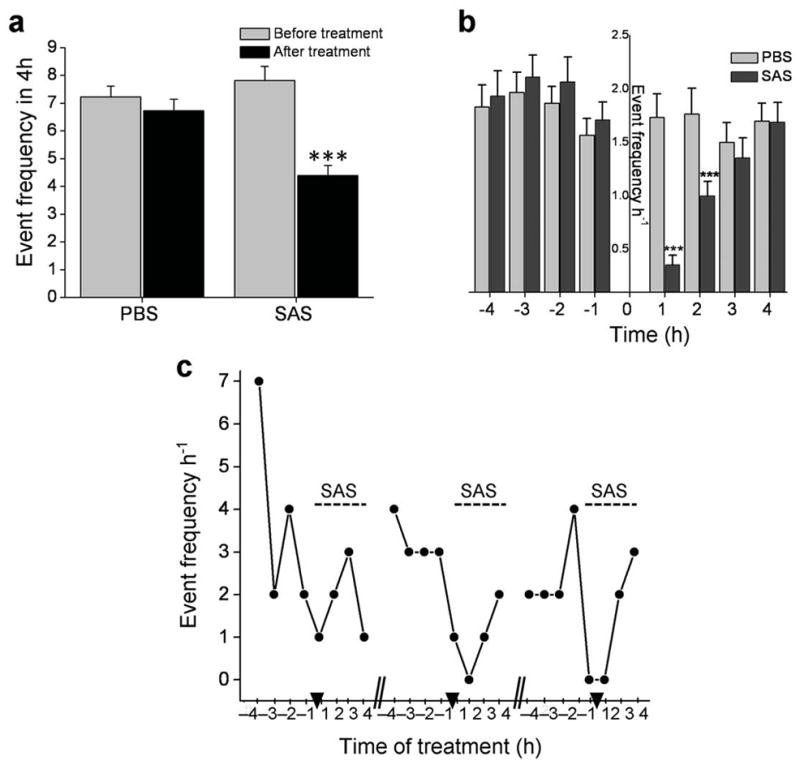
Epileptic seizures are a common and poorly understood comorbidity for individuals with primary brain tumors. To investigate peritumoral seizure etiology, we implanted human-derived glioma cells into severe combined immunodeficient mice. Within 14-18 d, glioma-bearing mice developed spontaneous and recurring abnormal electroencephalogram events consistent with progressive epileptic activity. Acute brain slices from these mice showed marked glutamate release from the tumor mediated by the system x(c)(-) cystine-glutamate transporter (encoded by Slc7a11). Biophysical and optical recordings showed glutamatergic epileptiform hyperexcitability that spread into adjacent brain tissue. We inhibited glutamate release from the tumor and the ensuing hyperexcitability by sulfasalazine (SAS), a US Food and Drug Administration-approved drug that blocks system x(c)(-). We found that acute administration of SAS at concentrations equivalent to those used to treat Crohn's disease in humans reduced epileptic event frequency in tumor-bearing mice compared with untreated controls. SAS should be considered as an adjuvant treatment to ameliorate peritumoral seizures associated with glioma in humans.


Conflict of interest statement

The authors declare no competing conflicts of interest.

Figures

Figure 1
Figure 1
Tumor-bearing mice exhibit abnormal spontaneous EEG activity indicative of epileptic activity. (a) Representative EEG recordings from 3 glioma-implanted animals juxtaposing abnormal events and baselines (BL) for each animal. (b) A power spectrum from one representative event (inset) and corresponding BL from the same animal. A distinct peak in the Power Spectrum between 12–15 Hz served as characteristic inclusion criteria. (c) Epileptic activity increases over time. Frequency of activity was quantified for 13 tumor-bearing mice over 10 consecutive days (d), with hourly event frequency plotted as a function of time. (d) U251GFP tumors were identified in acute cortical brain by fluorescence prior to conducting glutamate release assays. Scale bar = 1 mm. (e) Extracellular glutamate, released in the presence of 100 μM cystine, was measured from acute cortical brain slices from 7 sham-operated (n = 21 slices), and 9 U251GFP-implanted animals (n = 27) after 0.5, 1, and 2 h incubation. Glioma-bearing slices released significantly more glutamate, time-dependently, than sham slices at any time point *P < 0.05. In the presence of 250 μM SAS, glutamate release from glioma-bearing slices was significantly inhibited at 1 h (**P < 0.01) and 2 h (**P < 0.01) time points. Glutamate release from sham slices was not significantly affected by SAS at any time point.
Figure 2
Figure 2
Acute cortical slices from tumor-bearing mice exhibit spontaneous epileptiform activity. Examples of cresyl violet-stained brain slices from a sham (a), and a glioma-implanted animal (b), clearly shows the dark-stained U251GFP tumor. Scale bar = 350 μm. In the sham slice, the typical six-layered cortical lamination pattern is evident, but in the glioma-bearing slice, the lateral cortical laminar pattern is disorganized around the tumor. Recording (rec) and stimulating (stim) electrodes were placed in peritumoral regions and in corresponding regions of sham slices as shown. Tumor cells migrate deeper into the brain on white matter tracts (box), as shown in a slice at 10 x magnification (c). Scale bar = 150 μm. (d) Extracellular field recordings conducted in the presence of Mg2+ show spontaneous activity in the slice from a representative U251GFP-bearing animal that does not occur in the sham slice.
Figure 3
Figure 3
Acute cortical slices from tumor-bearing mice are hyperexcitable. Whole-cell recordings conducted in Mg2+-free bath on cortical slices from a sham-operated animal (a), and a tumor-bearing animal (b), illustrate a more rapid development of epileptiform activity in peritumoral neurons following Mg2+ removal as compared to sham neurons. Individual events are displayed on an expanded time scale below each recording. (c) Average latency to development of epileptiform activity was plotted for 16 neurons from 4 sham animals, and 16 U251GFP, 7 GBM12 and 13 GBM22 peritumoral neurons from 19 glioma-implanted animals. Latency was significantly shorter for peritumoral neurons compared to shams. *P < 0.05. (d) However, the average event duration was similar between all glioma-bearing slices and between glioma-bearing and sham slices.
Figure 4
Figure 4
Acute cortical slices from glioma-bearing mice show increased cortical network activity and hyperexcitable layer II/III peritumoral pyramidal cells. (a) Representative examples of optical recordings comparing a slice from a sham and a slice from a U251GFP-bearing animal incubated in the voltage dye RH414, then field- stimulated with 80 μA. Each image is a pseudo-colored representation of activity measured using a Neuroplex 464-diode array. Adjacent frames are 1.8 ms apart. (b) Spread of voltage response, measured by the number of activated diodes within the array, was significantly greater in glioma-bearing slices compared to shams. **P < 0.01. Summary of RMP (c) and input resistance (IR) (d) recorded using whole-cell patch clamp technique in peritumoral neurons from U251GFP, GBM12, and GBM22-implanted animals. (e) Examples of voltage responses to increasing amplitude current injections, from −100 pA to + 80 pA (in 20 pA steps) in whole-cell current clamped pyramidal peritumoral neurons in glioma-bearing and in sham slices (pulse duration, 500 ms). (f) The average action potential number obtained in response to 20, 40, 60 and 80 pA depolarizing current pulses are plotted as a function of applied current in the input-output curves to illustrate that peritumoral neurons exhibit significantly more action potentials *P < 0.05.
Figure 5
Figure 5
Sulfasalazine (SAS) application reduces epileptiform activity in acute cortical slices from glioma-bearing mice. Recordings of epileptiform activity exhibited by peritumoral neurons following removal of Mg2+ in animals bearing GBM12 (a), or GBM22 (b) tumors. Subsequent bath application of 250 μM SAS eliminated events lasting longer than 3 s, and event amplitude was reduced by 44%. Bath application of 50 μM APV, an NMDA receptor blocker, completely abolished all activity (c). (d) A cresyl violet-stained slice containing GBM22 shows the proximity of a biocytin-filled recorded neuron (inset) to the darker-stained tumor. Scale bars = 350μm and 150 μm.
Figure 6
Figure 6
Sulfasalazine reduces frequency of epileptic activity in tumor-bearing mice. (a) The average number of epileptic events for 8 SAS-treated and 6 PBS-treated tumor bearing mice was quantified for the 4 h period before and the 4 h period after treatment. Activity was significantly decreased in the 4 h period following SAS treatment (***P < 0.001), while PBS-injected animals showed no significant change in frequency. (b) The average hourly event frequency is plotted for 8 SAS treated animals compared to 6 PBS-treated mice before and after treatment. Injection time is indicated by “0”. The frequency of hourly activity was similar between SAS and PBS-treated animals in each of the 4 h before treatment; however, after treatment, mice given SAS experienced significantly less activity within the 1st h (***P < 0.001) and the 2nd h (**P< 0.01) compared to mice given PBS. (c) The effects of SAS treatment on epileptic activity indicate that mice do not become desensitized to the drug. The number of events that occurred by hour in the 8 h treatment block (4 h before and 4 h after) is displayed for one animal; hash marks separate 3 consecutive days and arrow heads indicate the time of SAS injection.

Comment in

Similar articles

Cited by

References

    1. Moots PL, et al. The course of seizure disorders in patients with malignant gliomas. Arch Neurol. 1995;52 :717–724. - PubMed
    1. van Breemen MS, et al. Efficacy of anti-epileptic drugs in patients with gliomas and seizures. J Neurol. 2009;256:1519–1526. - PubMed
    1. Hauser WA, Annegers JF, Kurland LT. Incidence of epilepsy and unprovoked seizures in Rochester, Minnesota: 1935–1984. Epilepsia. 1993;34:453–468. - PubMed
    1. During MJ, Spencer DD. Extracellular hippocampal glutamate and spontaneous seizure in the conscious human brain. Lancet. 1993;341:1607–1610. - PubMed
    1. Patt S, et al. Source localization and possible causes of interictal epileptic activity in tumor-associated epilepsy. Neurobiol Dis. 2000;7:260–269. - PubMed

Publication types

MeSH terms