Meta-Analysis
. 2011 Sep 11;43(10):1005-11.
doi: 10.1038/ng.922.

Genome-wide association study identifies six new loci influencing pulse pressure and mean arterial pressure

Louise V Wain  1 Germaine C VerwoertPaul F O'ReillyGang ShiToby JohnsonAndrew D JohnsonMurielle BochudKenneth M RicePeter HennemanAlbert V SmithGeorg B EhretNajaf AminMartin G LarsonVincent MooserDavid HadleyMarcus DörrJoshua C BisThor AspelundTõnu EskoA Cecile J W JanssensJing Hua ZhaoSimon HeathMaris LaanJingyuan FuGiorgio PistisJian'an LuanPankaj AroraGavin LucasNicola PirastuIrene PichlerAnne U JacksonRebecca J WebsterFeng ZhangJohn F PedenHelena SchmidtToshiko TanakaHarry CampbellWilmar IglYuri MilaneschiJouke-Jan HottengaVeronique VitartDaniel I ChasmanStella TrompetJennifer L Bragg-GreshamBehrooz Z AlizadehJohn C ChambersXiuqing GuoTerho LehtimäkiBrigitte KühnelLorna M LopezOzren PolašekMladen BobanChristopher P NelsonAlanna C MorrisonVasyl PihurSanthi K GaneshAlbert HofmanSuman KunduFrancesco U S Mattace-RasoFernando RivadeneiraEric J G SijbrandsAndre G UitterlindenShih-Jen HwangRamachandran S VasanThomas J WangSven BergmannPeter VollenweiderGérard WaeberJaana LaitinenAnneli PoutaPaavo ZittingWendy L McArdleHeyo K KroemerUwe VölkerHenry VölzkeNicole L GlazerKent D TaylorTamara B HarrisHelene AlavereToomas HallerAime KeisMari-Liis TammesooYurii AulchenkoInês BarrosoKay-Tee KhawPilar GalanSerge HercbergMark LathropSusana EyheramendyElin OrgSiim SõberXiaowen LuIlja M NolteBrenda W PenninxTanguy CorreCorrado MasciulloCinzia SalaLeif GroopBenjamin F VoightOlle MelanderChristopher J O'DonnellVeikko SalomaaAdamo Pio d'AdamoAntonella FabrettoFlavio FaletraSheila UliviFabiola M Del GrecoMaurizio FacherisFrancis S CollinsRichard N BergmanJohn P BeilbyJoseph HungA William MuskMassimo ManginoSo-Youn ShinNicole SoranzoHugh WatkinsAnuj GoelAnders HamstenPierre GiderMarisa LoitfelderMarion ZeginiggDena HernandezSamer S NajjarPau NavarroSarah H WildAnna Maria CorsiAndrew SingletonEco J C de GeusGonneke WillemsenAlex N ParkerLynda M RoseBrendan BuckleyDavid StottMarco OrruManuela UdaLifeLines Cohort StudyMelanie M van der KlauwWeihua ZhangXinzhong LiJames ScottYii-Der Ida ChenGregory L BurkeMika KähönenJorma ViikariAngela DöringThomas MeitingerGail DaviesJohn M StarrValur EmilssonAndrew PlumpJan H LindemanPeter A C 't HoenInke R KönigEchoGen consortiumJanine F FelixRobert ClarkeJemma C HopewellHalit OngenMonique BretelerStéphanie DebetteAnita L DestefanoMyriam FornageAortaGen ConsortiumGary F MitchellCHARGE Consortium Heart Failure Working GroupNicholas L SmithKidneyGen consortiumHilma HolmKari StefanssonGudmar ThorleifssonUnnur ThorsteinsdottirCKDGen consortiumCardiogenics consortiumCardioGramNilesh J SamaniMichael PreussIgor RudanCaroline HaywardIan J DearyH-Erich WichmannOlli T RaitakariWalter PalmasJaspal S KoonerRonald P StolkJ Wouter JukemaAlan F WrightDorret I BoomsmaStefania BandinelliUlf B GyllenstenJames F WilsonLuigi FerrucciReinhold SchmidtMartin FarrallTim D SpectorLyle J PalmerJaakko TuomilehtoArne PfeuferPaolo GaspariniDavid SiscovickDavid AltshulerRuth J F LoosDaniela TonioloHarold SniederChristian GiegerPierre MenetonNicholas J WarehamBen A OostraAndres MetspaluLenore LaunerRainer RettigDavid P StrachanJacques S BeckmannJacqueline C M WittemanJeanette ErdmannKo Willems van DijkEric BoerwinkleMichael BoehnkePaul M RidkerMarjo-Riitta JarvelinAravinda ChakravartiGoncalo R AbecasisVilmundur GudnasonChristopher Newton-ChehDaniel LevyPatricia B MunroeBruce M PsatyMark J CaulfieldDabeeru C RaoMartin D TobinPaul ElliottCornelia M van Duijn
Collaborators, Affiliations
Meta-Analysis

Genome-wide association study identifies six new loci influencing pulse pressure and mean arterial pressure

Louise V Wain et al. Nat Genet. .

Abstract

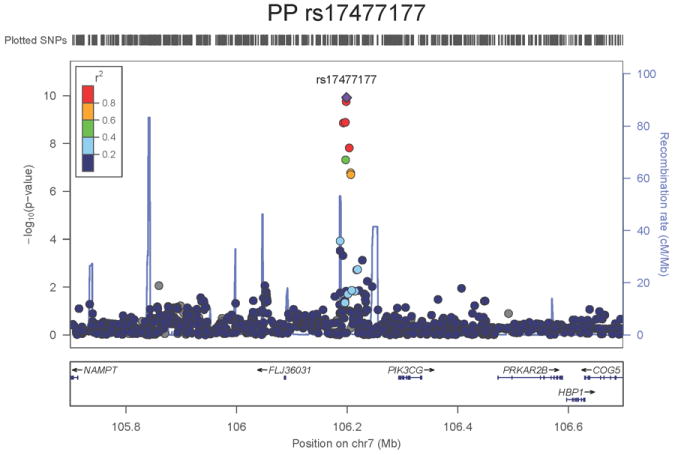
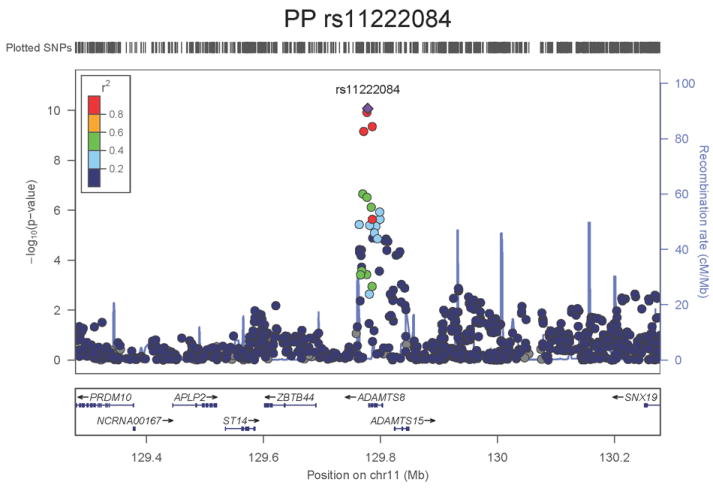
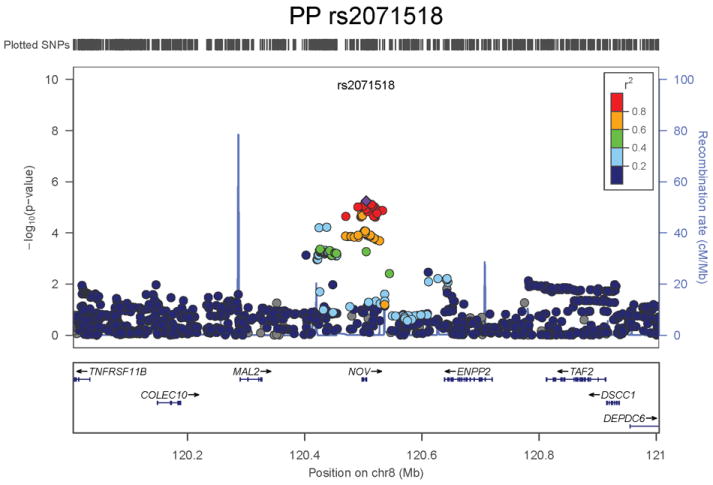
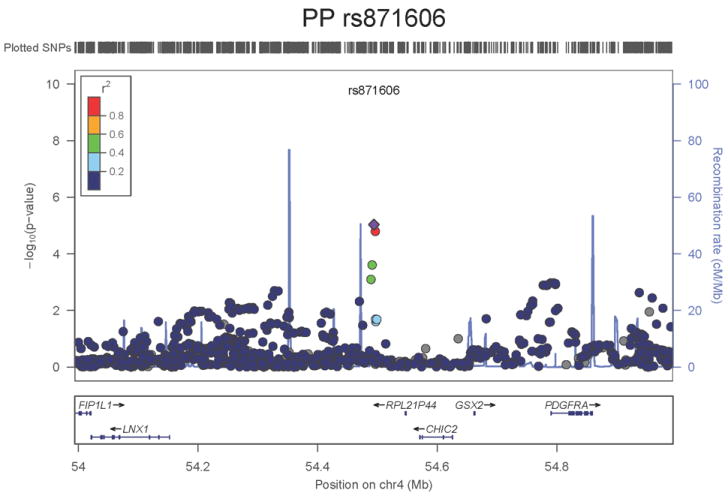
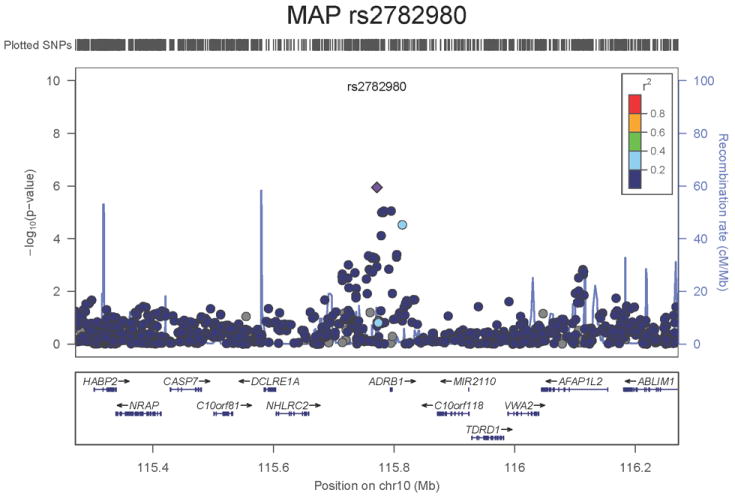
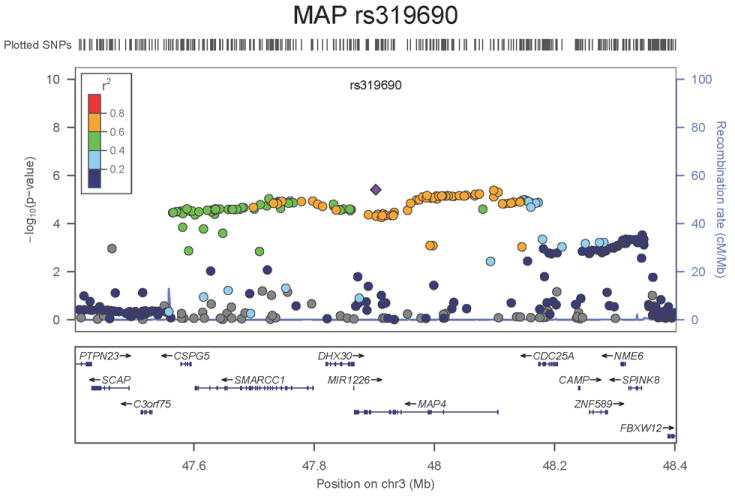
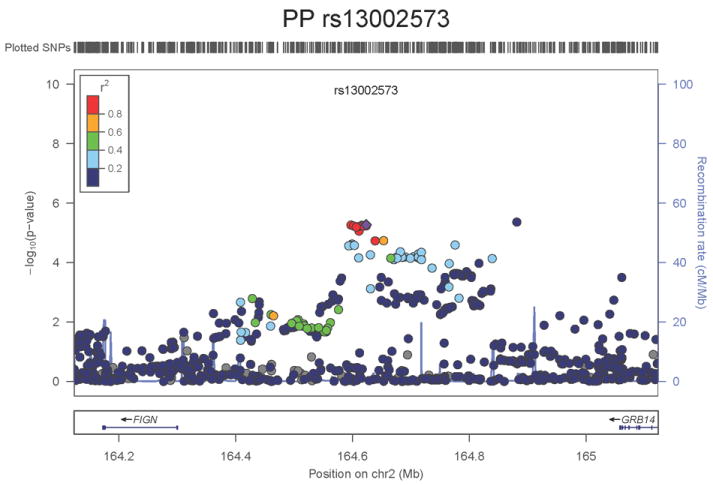
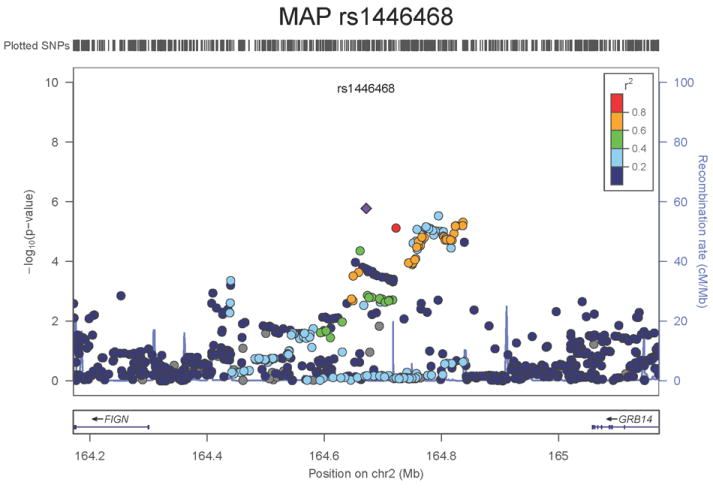
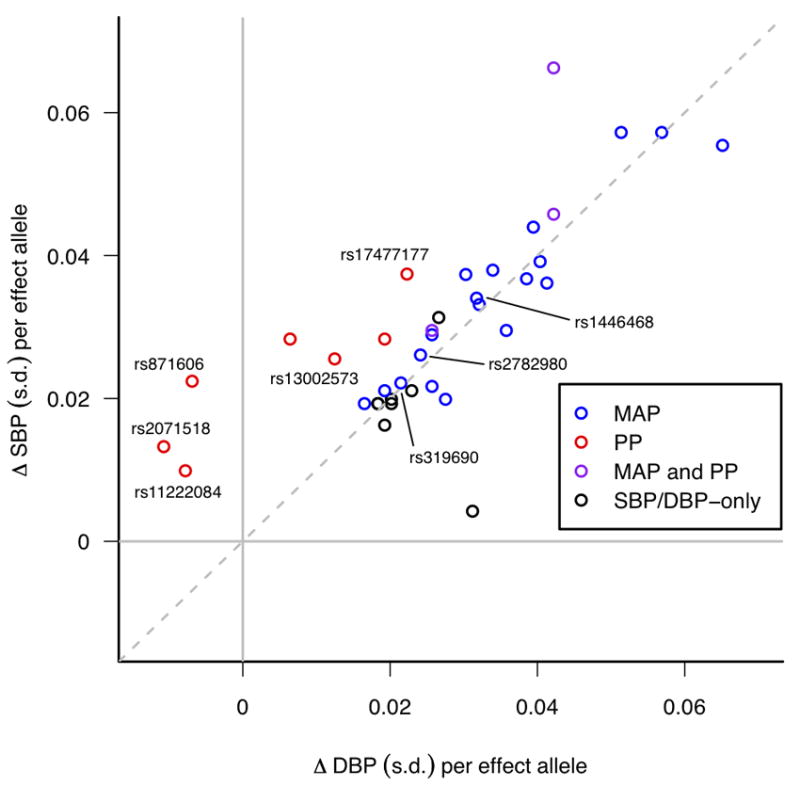
Numerous genetic loci have been associated with systolic blood pressure (SBP) and diastolic blood pressure (DBP) in Europeans. We now report genome-wide association studies of pulse pressure (PP) and mean arterial pressure (MAP). In discovery (N = 74,064) and follow-up studies (N = 48,607), we identified at genome-wide significance (P = 2.7 × 10(-8) to P = 2.3 × 10(-13)) four new PP loci (at 4q12 near CHIC2, 7q22.3 near PIK3CG, 8q24.12 in NOV and 11q24.3 near ADAMTS8), two new MAP loci (3p21.31 in MAP4 and 10q25.3 near ADRB1) and one locus associated with both of these traits (2q24.3 near FIGN) that has also recently been associated with SBP in east Asians. For three of the new PP loci, the estimated effect for SBP was opposite of that for DBP, in contrast to the majority of common SBP- and DBP-associated variants, which show concordant effects on both traits. These findings suggest new genetic pathways underlying blood pressure variation, some of which may differentially influence SBP and DBP.


Conflict of interest statement

Competing Financial Interests

A.C. is managed by Johns Hopkins Medicine. I.B. and spouse own stock in Incyte Ltd and GlaxoSmithKline. A.N.P is an employee of Amgen. G.F.M. is owner of Cardiovascular Engineering, Inc, a company that designs and manufactures devices that measure vascular stiffness. The company uses these devices in clinical studies that evaluate the effects of diseases and interventions on vascular stiffness. V.M. is an employee of GlaxoSmithKline plc. A.Plump is an employee of Merck and Co, Inc.

Figures

Figure 1
Figure 1
Regional association plots of the 8 SNPs at 7 loci showing genome-wide significant association (P<5×10⁻⁸) with pulse pressure and/or mean arterial pressure. Statistical significance of each SNP shown on the –log10 scale as a function of chromosome position (NCBI build 36) in the meta-analysis of stage 1 only. The sentinel SNP at each locus is shown in blue; the correlations (r2) of each of the surrounding SNPs to the sentinel SNP are shown in the colours indicated in the key. Fine –scale recombination rate is shown in blue. Gene positions are indicated at the bottom.
Figure 1
Figure 1
Regional association plots of the 8 SNPs at 7 loci showing genome-wide significant association (P<5×10⁻⁸) with pulse pressure and/or mean arterial pressure. Statistical significance of each SNP shown on the –log10 scale as a function of chromosome position (NCBI build 36) in the meta-analysis of stage 1 only. The sentinel SNP at each locus is shown in blue; the correlations (r2) of each of the surrounding SNPs to the sentinel SNP are shown in the colours indicated in the key. Fine –scale recombination rate is shown in blue. Gene positions are indicated at the bottom.
Figure 2
Figure 2
Systolic Blood Pressure (SBP) and Diastolic Blood Pressure (DBP) effect sizes (beta coefficients) for all BP SNPs identified in the present study and Ehret et al., obtained from follow-up samples only. Beta coefficients are shown as standard deviation (s.d.) differences so that SBP and DBP are measured on comparable scales. Points are colour-coded according to whether they are genome-wide significant (P<5×10⁻⁸) for Pulse Pressure (PP) (red), Mean Arterial Pressure (MAP) (blue) or both PP and MAP (purple) in stages 1 and 2 of the present study, while those that are significant only for SBP and/or DBP from Ehret et al. are shown in black. The novel SNPs found in the present study are labelled with their rs-numbers. For illustration purposes the effect allele for each SNP is defined such that the direction of the SBP effect is always positive.

References

    1. Ehret G, et al. Genetic Variants in Novel Pathways Influence Blood Pressure and Cardiovascular Disease Risk. Nature. 2011 - PMC - PubMed
    1. Levy D, et al. Genome-wide association study of blood pressure and hypertension. Nat Genet. 2009;41:677–87. - PMC - PubMed
    1. Newton-Cheh C, et al. Genome-wide association study identifies eight loci associated with blood pressure. Nat Genet. 2009;41:666–76. - PMC - PubMed
    1. Lawes CM, et al. Blood pressure and the global burden of disease 2000. Part II: estimates of attributable burden. J Hypertens. 2006;24:423–30. - PubMed
    1. Rose G. Strategies of prevention: the individual and the population. In: Marmot M, E P, editors. Coronary heart disease epidemiology: From aetiology to Public health. Oxford University Press; Oxford: 2005. pp. 631–41.

Publication types

Grants and funding