

AKT induces senescence in human cells via mTORC1 and p53 in the absence of DNA damage: implications for targeting mTOR during malignancy
- PMID: 21909130
- PMCID: PMC3325598
- DOI: 10.1038/onc.2011.394
AKT induces senescence in human cells via mTORC1 and p53 in the absence of DNA damage: implications for targeting mTOR during malignancy
Abstract
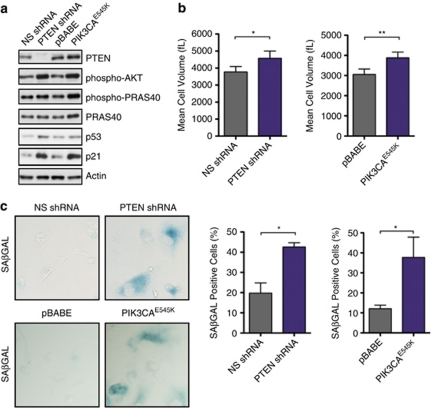
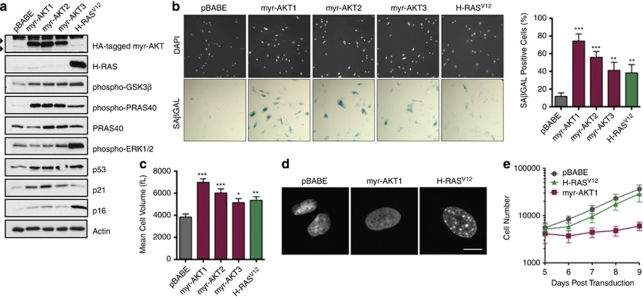
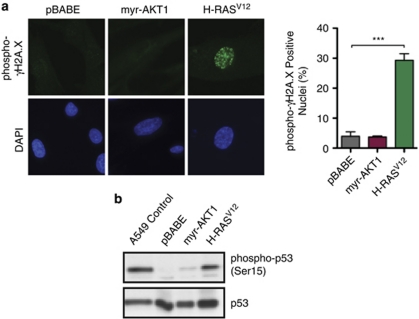
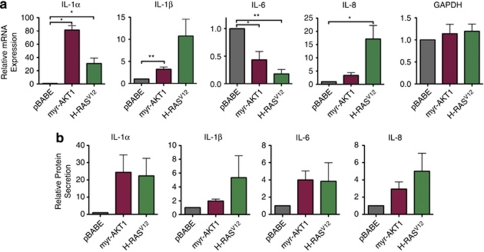
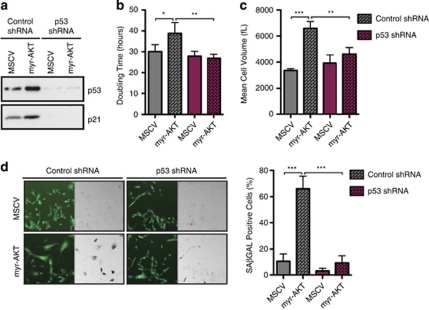
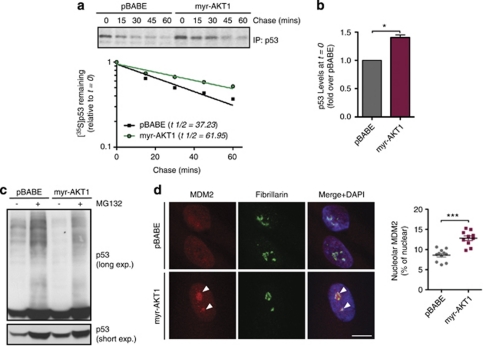
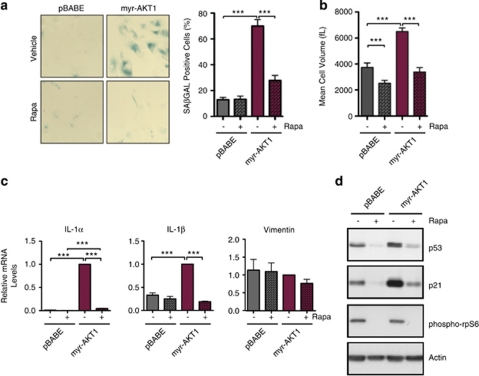
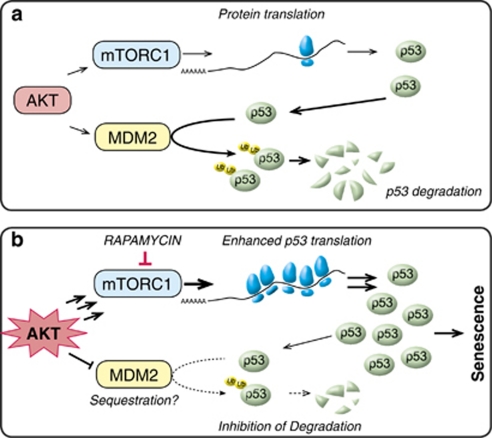
The phosphatidylinositol 3-kinase (PI3K)/AKT and RAS oncogenic signalling modules are frequently mutated in sporadic human cancer. Although each of these pathways has been shown to play critical roles in driving tumour growth and proliferation, their activation in normal human cells can also promote cell senescence. Although the mechanisms mediating RAS-induced senescence have been well characterised, those controlling PI3K/AKT-induced senescence are poorly understood. Here we show that PI3K/AKT pathway activation in response to phosphatase and tensin homolog (PTEN) knockdown, mutant PI3K, catalytic, α polypeptide (PIK3CA) or activated AKT expression, promotes accumulation of p53 and p21, increases cell size and induces senescence-associated β-galactosidase activity. We demonstrate that AKT-induced senescence is p53-dependent and is characterised by mTORC1-dependent regulation of p53 translation and stabilisation of p53 protein following nucleolar localisation and inactivation of MDM2. The underlying mechanisms of RAS and AKT-induced senescence appear to be distinct, demonstrating that different mediators of senescence may be deregulated during transformation by specific oncogenes. Unlike RAS, AKT promotes rapid proliferative arrest in the absence of a hyperproliferative phase or DNA damage, indicating that inactivation of the senescence response is critical at the early stages of PI3K/AKT-driven tumourigenesis. Furthermore, our data imply that chronic activation of AKT signalling provides selective pressure for the loss of p53 function, consistent with observations that PTEN or PIK3CA mutations are significantly associated with p53 mutation in a number of human tumour types. Importantly, the demonstration that mTORC1 is an essential mediator of AKT-induced senescence raises the possibility that targeting mTORC1 in tumours with activated PI3K/AKT signalling may exert unexpected detrimental effects due to inactivation of a senescence brake on potential cancer-initiating cells.
Figures
Similar articles
-
mTOR kinase leads to PTEN-loss-induced cellular senescence by phosphorylating p53.Oncogene. 2019 Mar;38(10):1639-1650. doi: 10.1038/s41388-018-0521-8. Epub 2018 Oct 18. Oncogene. 2019. PMID: 30337688 Free PMC article.
-
Ran is a potential therapeutic target for cancer cells with molecular changes associated with activation of the PI3K/Akt/mTORC1 and Ras/MEK/ERK pathways.Clin Cancer Res. 2012 Jan 15;18(2):380-91. doi: 10.1158/1078-0432.CCR-11-2035. Epub 2011 Nov 16. Clin Cancer Res. 2012. PMID: 22090358 Free PMC article.
-
Nuclear PRAS40 couples the Akt/mTORC1 signaling axis to the RPL11-HDM2-p53 nucleolar stress response pathway.Oncogene. 2015 Mar 19;34(12):1487-98. doi: 10.1038/onc.2014.91. Epub 2014 Apr 7. Oncogene. 2015. PMID: 24704832 Free PMC article.
-
Targeting the translational apparatus to improve leukemia therapy: roles of the PI3K/PTEN/Akt/mTOR pathway.Leukemia. 2011 Jul;25(7):1064-79. doi: 10.1038/leu.2011.46. Epub 2011 Mar 25. Leukemia. 2011. PMID: 21436840 Review.
-
Emerging roles of the p38 MAPK and PI3K/AKT/mTOR pathways in oncogene-induced senescence.Trends Biochem Sci. 2014 Jun;39(6):268-76. doi: 10.1016/j.tibs.2014.04.004. Epub 2014 May 9. Trends Biochem Sci. 2014. PMID: 24818748 Free PMC article. Review.
Cited by
-
Cardiac cell senescence: molecular mechanisms, key proteins and therapeutic targets.Cell Death Discov. 2024 Feb 14;10(1):78. doi: 10.1038/s41420-023-01792-5. Cell Death Discov. 2024. PMID: 38355681 Free PMC article. Review.
-
Senescence determines the fate of activated rat pancreatic stellate cells.J Cell Mol Med. 2012 Nov;16(11):2620-30. doi: 10.1111/j.1582-4934.2012.01573.x. J Cell Mol Med. 2012. PMID: 22452900 Free PMC article.
-
Deciphering the Molecular Mechanism of Spontaneous Senescence in Primary Epithelial Ovarian Cancer Cells.Cancers (Basel). 2020 Jan 27;12(2):296. doi: 10.3390/cancers12020296. Cancers (Basel). 2020. PMID: 32012719 Free PMC article.
-
Strategies targeting cellular senescence.J Clin Invest. 2018 Apr 2;128(4):1247-1254. doi: 10.1172/JCI95149. Epub 2018 Apr 2. J Clin Invest. 2018. PMID: 29608140 Free PMC article. Review.
-
Identification of Salvia haenkei as gerosuppressant agent by using an integrated senescence-screening assay.Aging (Albany NY). 2016 Dec 1;8(12):3223-3240. doi: 10.18632/aging.101076. Aging (Albany NY). 2016. PMID: 27922821 Free PMC article.
References
-
- Abramoff M, Magelhaes P, Ram S. Image processing with image J. Biophotonics Int. 2004;11:36–42.
-
- Acosta JC, O'Loghlen A, Banito A, Guijarro MV, Augert A, Raguz S, et al. Chemokine signaling via the CXCR2 receptor reinforces senescence. Cell. 2008;133:1006–1018. - PubMed
-
- Altomare D, Testa J. Perturbations of the AKT signaling pathway in human cancer. Oncogene. 2005;24:7455–7464. - PubMed
Publication types
MeSH terms
Substances
LinkOut - more resources
Full Text Sources
Other Literature Sources
Molecular Biology Databases
Research Materials
Miscellaneous
