. 2011 Sep;96(2):155-76.
doi: 10.1901/jeab.2011.96-155.

Adaptive criterion setting in perceptual decision making

Affiliations

Adaptive criterion setting in perceptual decision making

Maik C Stüttgen et al. J Exp Anal Behav. 2011 Sep.

Abstract

Pigeons responded in a perceptual categorization task with six different stimuli (shades of gray), three of which were to be classified as "light" or "dark", respectively. Reinforcement probability for correct responses was varied from 0.2 to 0.6 across blocks of sessions and was unequal for correct light and dark responses. Introduction of a new reinforcement contingency resulted in a biphasic process of adjustment: First, choices were strongly biased towards the favored alternative, which was followed by a shift of preference back towards unbiased choice allocation. The data are well described by a signal detection model in which adjustment to a change in reinforcement contingency is modeled as the change of a criterion along a decision axis with fixed stimulus distributions. Moreover, the model shows that pigeons, after an initial overadjustment, distribute their responses almost optimally, although the overall benefit from doing so is extremely small. The strong and swift effect of minute changes in overall reinforcement probability precludes a choice strategy directly maximizing expected value, contrary to the assumption of signal detection theory. Instead, the rapid adjustments observed can be explained by a model in which reinforcement probabilities for each action, contingent on perceived stimulus intensity, determine choice allocation.

Keywords: expected value; generalized matching law; key peck; optimal choice; pigeon; psychophysics; signal detection theory; yes-no task.


Figures
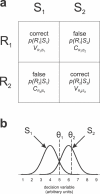
Fig 1
Fig 1
Illustration of signal detection theoretical concepts. (a) Payoff matrix denoting the outcomes of two possible actions, R1 and R2, in two possible conditions, presence of stimulus S1 and presence of stimulus S2. (b) Presentations of S1 and S2 are hypothesized to yield values on an internal decision variable. The observer is assumed to decide which of the two stimuli is present on the basis of an internal decision criterion θ, of which two examples are shown.
Fig 2
Fig 2
Schematic of the behavioral paradigm. Sequence of events runs from top to bottom, boxes represent three pecking keys arranged next to each other. After an intertrial interval (ITI) of 4 s, the center key is illuminated green. After a single peck, the center key displays one of six possible sample stimuli (shades of gray) for 1 s. Then, the center key turns green again. After a single peck, the center key is turned off, and the side keys are illuminated orange. The subject has to indicate its decision by pecking either choice key once. If correct, a food hopper is activated for 2 s according to a probabilistic schedule (see Method). If incorrect, all lights are switched off for 2 s (time-out).
Fig 3
Fig 3
Mean proportion of left choice responses for the last five sessions of each contingency for individual birds. For the .5|.5 condition, filled circles represent first block, open circles represent last block of experiment.
Fig 4
Fig 4
Mean proportion of left choice responses for the last five sessions of each contingency, averaged over all birds. Conventions as in Figure 3.
Fig 5
Fig 5
Changes in threshold and slope across experimental sessions for individual birds. Lines are broken for birds 810, 935, and 947; data for these sessions could not be fitted reasonably well (r2 < .65), and the corresponding data points have been omitted. Vertical gray lines denote changes in reinforcement contingency. Pairs of numbers in the plot indicate reinforcement probabilities for correct responses within one block (S1 and S2). The first and last blocks provided equal probabilities of reinforcement (.5) for both stimulus categories. Thin horizontal dotted lines denote unbiased responding.
Fig 6
Fig 6
Changes in choice probability across experimental sessions, averaged across all subjects. Error bars represent the standard error of the mean (SEM). Conventions as in Figure 4.
Fig 7
Fig 7
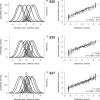
Signal-detection-theory-based model applied to the data of each individual pigeon. Left panels show relative locations of six hypothetical stimulus distributions along an internal decision axis. The order of stimulus distributions on the decision axis is perfectly correlated with the order of gray values (left to right, dark to bright). Gray histogram shows distribution of decision criterion values across all sessions as estimated by the model. Right panels show scatterplots of empirical against theoretical fractions of left key pecks across all stimuli and experimental sessions, along with best fitting regression lines, regression equations, and goodness of fit (r2).
Fig 7
Fig 7
Continued.
Fig 8
Fig 8
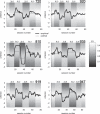
Modeled criterion dynamics in relation to reinforcement contingencies and criterion-dependent outcomes for individual birds. Bold lines depict changes in decision criterion experimental sessions, thin solid lines depict optimal placement of decision criteria. Grayscale background represents the objective reward function (expected reinforcers per trial, see colorbar) for each block of sessions (pairs of reinforcement probabilities) and each possible criterion.
Fig 9
Fig 9
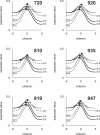
Feedback functions and steady-state criterion placement for individual birds. Each panel depicts five functions, one for each contingency of reinforcement, relating criterion placement to expected payoff (reinforcers per trial). Dotted line represents symmetrical reinforcement probabilities, solid gray lines represent conditions favoring S1, solid black lines represent conditions favoring S2. Dots on each curve depict criterion values averaged over the last five sessions of each contingency.
Fig 10
Fig 10
Foraging efficiency of individual birds, calculated as the expected total number of reinforcers attained with criterion values modeled for each bird relative to the expected number of reinforcers attained by an ideal observer (black line). Gray lines show the expected number of reinforcers attained by an unbiased observer having the same modeled sensitivity as each bird, divided by the expected number of reinforcers attained by an ideal observer with identical sensitivity.
Fig 11
Fig 11
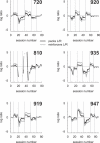
Response ratios consistently undermatch reinforcer ratios. Panels show the logarithm of ratios of left and right responses (black lines) and ratios of reinforcers obtained from responding left and right (gray lines). Absolute values for the latter are consistently larger than for the former, indicating undermatching. Missing data points for Bird 810 result from exclusive preference for one option, precluding the calculation of meaningful ratios.
Fig 12
Fig 12
Outline of decision-theoretic model, based on Boneau and Cole (1967). (a) Discriminal distributions (gray lines) for six stimuli equidistant in perceptual space and their sum (bold black line). (b) S1 and S2 action values as functions of λ when reinforcement probabilities are equal. (c) S1 and S2 action values as functions of λ when reinforcement probability for S1 is twice as large as for S2.

Similar articles

Cited by

References

    1. Alsop B, Porritt M. Discriminability and sensitivity to reinforcer magnitude in a detection task. Journal of the Experimental Analysis of Behavior. 2006;85:41–56. - PMC - PubMed
    1. Balci F, Freestone D, Gallistel C.R. Risk assessment in man and mouse. Proceedings of the National Academy of Sciences of the United States of America. 2009;106:2459–2463. - PMC - PubMed
    1. Baum W.M. On two types of deviation from the matching law: bias and undermatching. Journal of the Experimental Analysis of Behavior. 1974;22:231–242. - PMC - PubMed
    1. Baum W.M. Optimization and the matching law as accounts of instrumental behavior. Journal of the Experimental Analysis of Behavior. 1981;36:387–403. - PMC - PubMed
    1. Baum W.M. Dynamics of choice: a tutorial. Journal of the Experimental Analysis of Behavior. 2010;94:161–174. - PMC - PubMed

LinkOut - more resources