. 2011 Sep;96(2):215-25.
doi: 10.1901/jeab.2011.96-215.

Preference as a function of active interresponse times: a test of the active time model

Affiliations

Preference as a function of active interresponse times: a test of the active time model

Paul Misak et al. J Exp Anal Behav. 2011 Sep.

Abstract

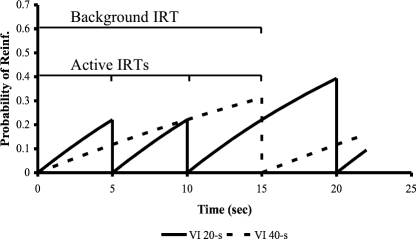
In this article, we describe a test of the active time model for concurrent variable interval (VI) choice. The active time model (ATM) suggests that the time since the most recent response is one of the variables controlling choice in concurrent VI VI schedules of reinforcement. In our experiment, pigeons were trained in a multiple concurrent similar to that employed by Belke (1992), with VI 20-s and VI 40-s schedules in one component, and VI 40-s and VI 80-s schedules in the other component. However, rather than use a free-operant design, we used a discrete-trial procedure that restricted interresponse times to a range of 0.5-9.0 s. After 45 sessions of training, unreinforced probe periods were mixed with reinforced training periods. These probes paired the two stimuli associated with the VI 40-s schedules. Further, the probes were defined such that during their occurrence, interresponse times were either "short" (0.5-3.0 s) or "long" (7.5-9.0 s). All pigeons showed a preference for the stimulus associated with the relatively rich VI 40-s schedule--a result mirroring that of Belke. We also observed, though, that this preference was more extreme during long probes than during short probes--a result predicted by ATM.

Keywords: Belke (1992); active time model; interresponse times; pigeons; stay/switch model; variable-intervals.


Figures

Fig 1
Fig 1
Active and background interresponse times. The figure assumes that a subject responds once every 5 s, and shows the relationship between interresponse times (IRTs) and reinforcement probabilities programmed according to Equation 1. In this case, the subject is shown to make two responses to the VI 20-s schedule, one response to the VI 40-s schedule, before switching back to the VI 20-s schedule. Notice that choosing an alternative immediately resets its probability of reinforcement to 0. Further, the figure highlights two types of IRT: active and background. As the subject responds, the time since the last peck to the alternative schedule, that is, the background IRT, increases. Conversely, the active IRT is defined as the time since the most recent choice, regardless of the alternative selected.
Fig 2
Fig 2
Active time functions for 3 subjects. The data shown here is taken from Cleaveland (1999), and shows the behavior of 3 pigeons in a discrete-trial, concurrent VI 60-s VI 180-s schedule of reinforcement. Both plots provide the probability of switching from a schedule given increasing, active IRTs. Plots on the left are for cases in which the most recent response was to the VI 60-s schedule, while the plots on the right are for cases in which the most recent response was to the VI 180-s schedule. Note that when the most recent response was to the relatively rich, VI 60-s schedule, birds were more likely to select the VI 60-s schedule again as active IRTs increased. In contrast, when the most recent response was to the relatively lean, VI 180-s schedule, birds were more likely to switch away from the VI 180-s schedule as active IRTs increased.
Fig 3
Fig 3
Our predictions are based on the assumption that pigeons learn typical rich versus lean, active IRT switch functions. As noted in the text, after responding to a relatively rich VI schedule pigeons have been found to be more likely to switch after shorter than longer active IRTs. Conversely, after responding to a relatively lean VI schedule, pigeons usually show a high probability of switching across all active IRTs. In other words, at short active IRTs the difference between switching probabilities (dshort) for the relatively lean and rich schedules would be small in comparison to switch probabilities after long IRTs (dlong). If switch probabilities determine overall preference at suggested by the active time model (ATM), then we would predict that pigeons would show more extreme schedule preferences after long active IRTs than after short active IRTs. Our experiment tests this hypothesis via probe trials in which a restricted portion of IRTs are allowed, and pigeons are given a choice between stimuli previously paired with a relatively rich VI 40-s stimulus (VI 4080) and a relatively lean VI 40-s schedule (VI 4020).
Fig 4
Fig 4
Functions showing the probability of a switch given different active IRT bins during the last 15 sessions of multiple concurrent VI VI training. Time bins ranged from IRTs less than 3 s to IRTs greater than 7 s. From top to bottom plots are for Birds 6-10, respectively. Plots in the left column (filled symbols) indicate cases in which the most recent response was to the relatively rich schedule of a concurrent pair. Plots in the right column (empty symbols) indicate cases in which the most recent response was to the relatively lean schedule of a concurrent pair. Circles specify the VI 20-s VI 40-s pair, while squares specify the VI 40-s VI 80-s pair.
Fig 5
Fig 5
Differences between the switch functions provided in Figure 4. Specifically, the figure shows the difference between the relatively rich VI 4080 and the relatively lean VI 4020 functions and the shortest and longest active IRT time bins. Bars left to right indicate Birds 6–10, respectively. The function differences permit a qualitative prediction of ATM for probe tests that will pair the stimuli associated with the VI 40-s schedules (see Figure 3). ATM predicts that small differences would correspond to indifference during probe tests. Negative values correspond to preference for the VI 4020 stimulus, while positive values correspond to preference for the VI 4080 stimulus. Thus, Figure 5 leads to the prediction that our Long probes will produce a much greater preference for the VI 4080 stimulus than will be shown during our Short probes.
Fig 6
Fig 6
Obtained probe preferences. The bar plots provide the proportion of responses made to the VI 4080 stimulus during Short and Long probe intervals. Bars left to right indicate Birds 6–10, respectively. Note that the x-axis crosses at 0.5, which would correspond to an equal number of responses being made to the VI 4080 and the VI 4020 stimuli (i.e., indifference). Therefore, proportions less than 0.5 indicate preference for the VI 4020 stimulus, while proportions greater than .5 indicate a preference for the VI 4080 stimulus. As predicted by ATM, Figure 6 shows that preference for the VI 4080 stimulus became more extreme during Long probe intervals as compared with Short probe intervals.

Similar articles

Cited by

References

    1. Baum W.M. On two types of deviation from the matching law: Bias and undermatching. Journal of the Experimental Analysis of Behavior. 1974;22:231–242. - PMC - PubMed
    1. Baum W.M. Matching, undermatching and overmatching in studies of choice. Journal of the Experimental Analysis of Behavior. 1979;32:269–281. - PMC - PubMed
    1. Belke T.W. Stimulus preference and the transitivity of preference. Animal Learning & Behavior. 1992;20:401–406.
    1. Brown E, Cleaveland J.M. An application of the active time model to multiple concurrent variable-interval schedules. Behavioural Processes. 2009;81:250–255. - PubMed
    1. Cleaveland J.M. Interresponse-time sensitivity during discrete-trial and free-operant concurrent variable-interval schedules. Journal of the Experimental Analysis of Behavior. 1999;72:317–339. - PMC - PubMed