. 2005;3(3):181-203.
doi: 10.1017/S1472928807000209. Epub 2007 Jan 22.

Cellular and network mechanisms of genetically-determined absence seizures

Affiliations

Cellular and network mechanisms of genetically-determined absence seizures

Didier Pinault et al. Thalamus Relat Syst. 2005.

Abstract

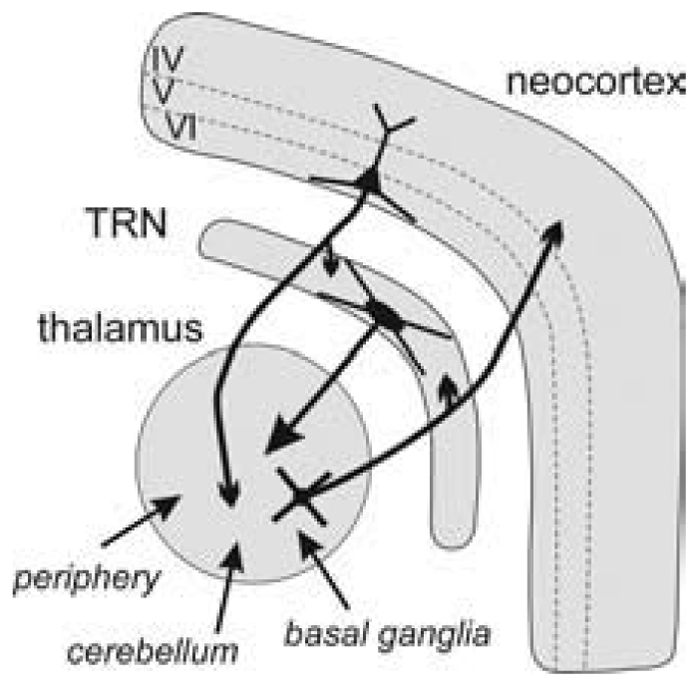
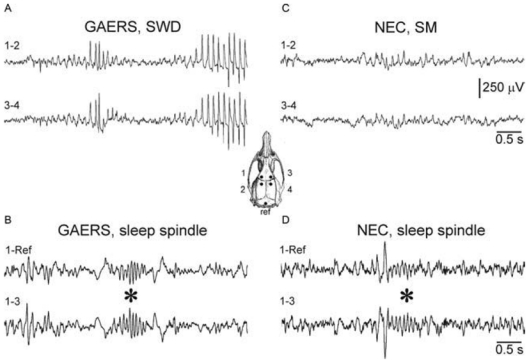
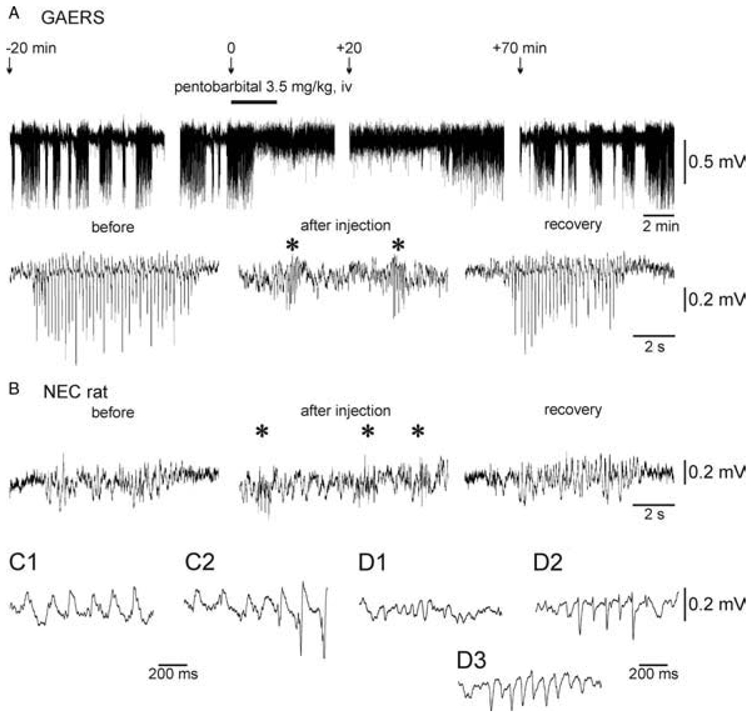
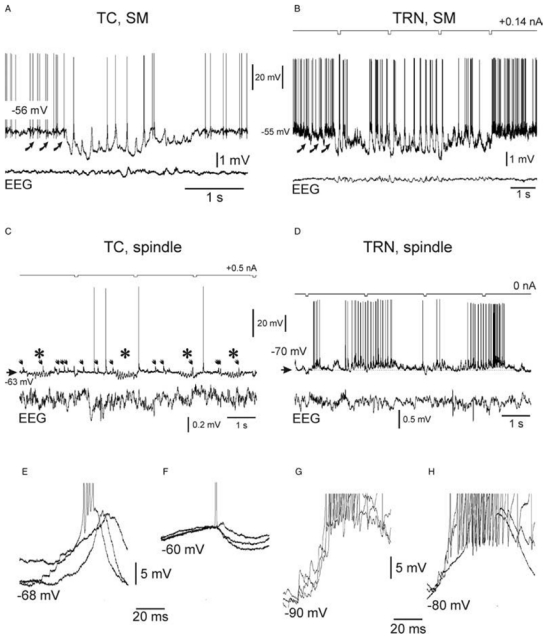
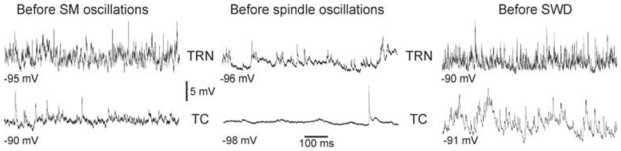
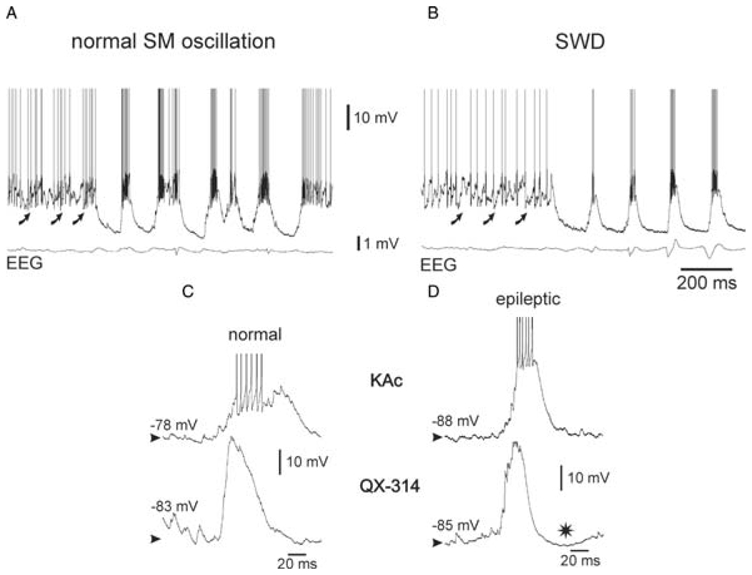
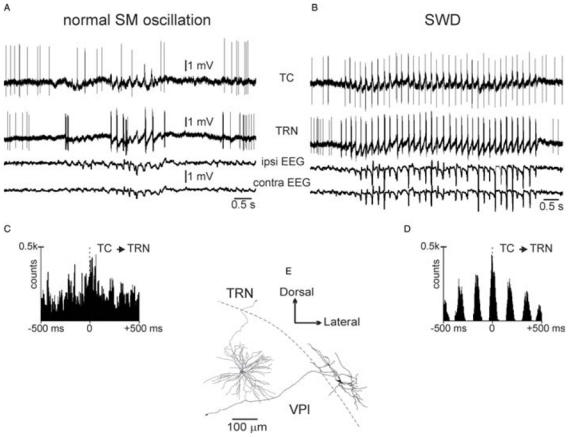
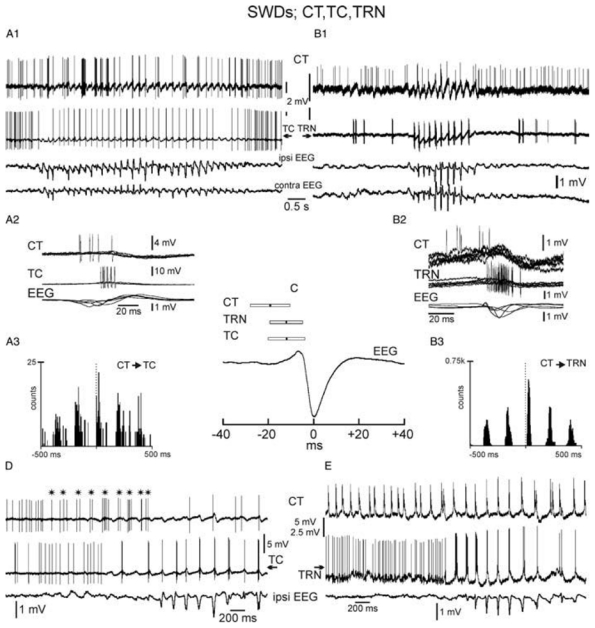
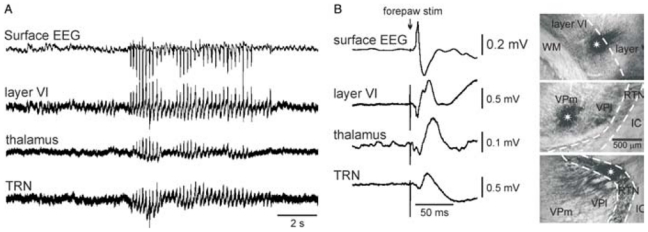
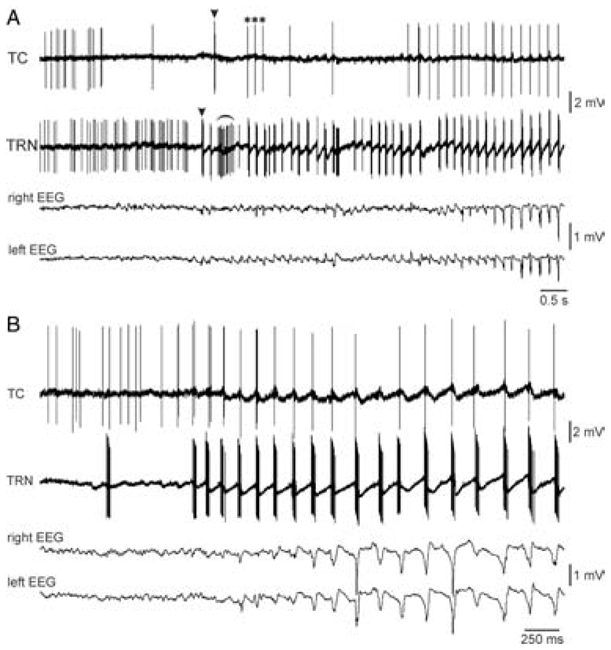
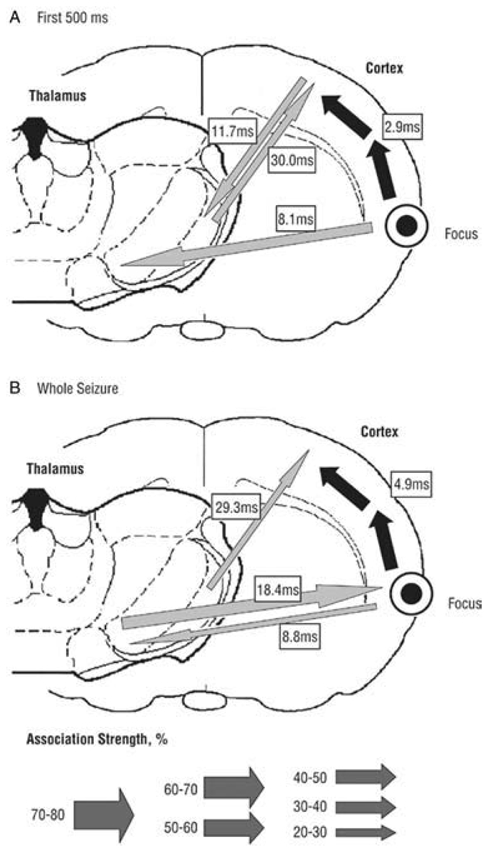
The absence epilepsies are characterized by recurrent episodes of loss of consciousness associated with generalized spike-and-wave discharges, with an abrupt onset and offset, in the thalamocortical system. In the absence of detailed neurophysiological studies in humans, many of the concepts regarding the pathophysiological basis of absence seizures are based on studies in animal models. Each of these models has its particular strengths and limitations, and the validity of findings from these models for the human condition cannot be assumed. Consequently, studies in different models have produced some conflicting findings and conclusions. A long-standing concept, based primarily from studies in vivo in cats and in vitro brain slices, is that these paroxysmal electrical events develop suddenly from sleep-related spindle oscillations. More specifically, it is proposed that the initial mechanisms that underlie absence-related spike-and-wave discharges are located in the thalamus, involving especially the thalamic reticular nucleus. By contrast, more recent studies in well-established, genetic models of absence epilepsy in rats demonstrate that spike-and-wave discharges originate in a cortical focus and develop from a wake-related natural corticothalamic sensorimotor rhythm. In this review we integrate recent findings showing that, in both the thalamus and the neocortex, genetically-determined, absence-related spike-and-wave discharges are the manifestation of hypersynchronized, cellular, rhythmic excitations and inhibitions that result from a combination of complex, intrinsic, synaptic mechanisms. Arguments are put forward supporting the hypothesis that layer VI corticothalamic neurons act as 'drivers' in the generation of spike-and-wave discharges in the somatosensory thalamocortical system that result in corticothalamic resonances particularly initially involving the thalamic reticular nucleus. However an important unresolved question is: what are the cellular and network mechanisms responsible for the switch from physiological, wake-related, natural oscillations into pathological spike-and-wave discharges? We speculate on possible answers to this, building particularly on recent findings from genetic models in rats.


Figures

Fig. 1
Fig. 1. Schematic of the thalamocortical system
The thalamus is reciprocally connected with the cerebral cortex and with the thalamic reticular nucleus (TRN). It receives many inputs from the periphery (sensory), cerebellum and basal ganglia. The TRN is a reservoir of GABAergic neurons that project to the dorsal thalamus. Thalamocortical and corticothalamic neurons are glutamatergic and cross the TRN where they give off axon collaterals.
Fig. 2
Fig. 2. Sensorimotor (SM) oscillations give rise to absence-related SWDs
(A) In freely moving GAERS, SWDs spontaneously arise from bilaterally synchronous, medium-voltage SM (or 5–9Hz) oscillations in the surface EEG. (C) Similar synchronized rhythmic EEG activity, without SWDs, was recorded in non-epileptic control (NEC) rats. These SM oscillations are distinguishable from sleep spindles (waves at 7–15 Hz) (* in B), which were often preceded by a K-complex (* in D). The inset illustrates the location of the EEG electrodes (Ref = reference) on the frontoparietal cortex. Also note that, in contrast to sleep spindles (B and C), SM oscillations emerge from a desynchronized EEG (A and C). The scale bars are valid for each recording. Adapted from (Pinault et al., 2001).
Fig. 3
Fig. 3. Pentobarbital abolishes SWDs and induces spindle-like oscillations
(A) Top: Surface EEG recordings (truncated) over the primary somatosensory cortex in a GAERS under neuroleptic analgesia, which received a subanaesthetic dose of pentobarbital. Bottom: Expanded EEG traces. Before pentobarbital injection and during the recovery period, the EEG displays recurrent high-voltage SWDs of variable duration. Note that pentobarbital suppresses SWDs and induces the occurrence of spindle-like episodes (*) in a GAERS (A) and in a non-epileptic control (NEC) rat (B). (B) In a NEC rat, SM oscillations occur spontaneously before and at least 20–30min after pentobarbital injection (recovery). (C) Expanded traces of a typical SM oscillation recorded in a NEC rat (C1) and a SM oscillation that gives rise to a SWD in a GAERS (C2). (D) Three types of spindle-like oscillations recorded in GAERS and NEC rats after barbiturate administration: (D1) contains only sinusoid-like waves; (D2) biphasic spikes; and (D3) mainly monophasic spikes. Adapted from (Pinault et al., 2006).
Fig. 4
Fig. 4. Thalamic relay (A,C,E,F) and reticular (B,D,G,H) intracellular rhythmic activities associated with either spontaneously occurring SM or spindle-like oscillations in the related surface EEG
Intracellular recordings are from non-epileptic control (NEC) rats. (A) Intracellular rhythmic activity of a thalamocortical (TC) neuron associated with spontaneously occurring SM oscillations in the simultaneous surface EEG recording. (B) Intracellular rhythmic activity of a thalamic reticular nucleus (TRN) neuron associated with spontaneously occurring SM oscillations in the related surface EEG. A current square pulse of −0.2 nA was delivered every 2sec. The curved arrows in A and B indicate barrages of EPSPs. (C) Barbiturate-induced intracellular spindle-like oscillations (7–15Hz; *) in a TC neuron. Note that individual synaptic potentials of presumably lemniscal origin (arrows) occur during and in between the spindle-like episodes. Note that these postsynaptic potentials do not trigger a low-threshold Ca2+ potential. (D) Barbiturate-induced intracellular spindle-like oscillations (7–15 Hz) in a TRN neuron. (E,F) Superimposition of three successive rhythmic depolarizations, which occur during SM (E) and during spindle-like oscillations (F) in a TC cell. Note the occurrence of small synaptic and/or intrinsic unitary events at the beginning of the depolarizing waves in E. In E, one of the three depolarizations triggers an apparent low-threshold Ca2+ spike topped by a high-frequency burst of action potentials, whereas in F only a single action potential was evoked during one of the events. (G,H) Superimposition of three successive rhythmic depolarizations, which occur during SM (G) and spindle-like oscillations (H) in a TRN cell. Note the occurrence of synaptic and/or intrinsic unitary events at the beginning of the depolarizing waves in G and H. The action potentials are truncated in E–H. Adapted from (Pinault, 2003; Pinault et al., 2006).
Fig. 5
Fig. 5. The membrane potential of thalamic neurons displays more powerful fast rhythmic activities between SM oscillations and SWDs than between spindle-like oscillations
Intracellular recordings of spontaneously occurring membrane potential oscillations in thalamic reticular nucleus (TRN) and thalamocortical (TC) neurons, which occur before the occurrence of SM oscillations (in a NEC rat under neuroleptic analgesia), the occurrence of absence-related SWDs (in GAERS, under neuroleptic analgesia), and the occurrence of spindle-like oscillations (in a NEC rat after barbiturate treatment). These recordings were obtained while applying DC hyperpolarizing current of at least −1 nA. Adapted from (Pinault et al. 2006).
Fig. 6
Fig. 6. Normal- and absence-related intracellular SM oscillations in thalamic reticular nucleus neurons are qualitatively similar
Intracellular recordings of thalamic reticular nucleus neurons during a spontaneously occurring SM oscillation (A) and a spike-and-wave discharge (SWD) (B) in the EEG in a NEC rat and in a GAERS, respectively. The curved arrows in A and B indicate rhythmic barrages of EPSPs. (C,D) Comparison of two typical recurring threshold depolarizing waves, which were recorded during normal SM oscillations in a NEC rat (C) and during SWDs in a GAERS (D), respectively. The intracellular recordings were made with a KAc-(upper traces) or QX-314-filled (lower traces) micropipette. * in D indicates a late hyperpolarization that probably results from a Ca2+-activated K+ current. The action potentials are truncated in C and D for clarity. Adapted from (Pinault, 2003).
Fig. 7
Fig. 7. Paired, single-cell, extracellular recordings of TC and TRN neurons of the somatosensory system during a spontaneously occurring, medium-voltage, SM oscillation and an absence-related spike-and-wave discharge in a GAERS
(A,B) Recordings are from the same TC–TRN pair in a GAERS. (C,D) Superimposition of four representative cross-correlograms (2 msec resolution) computed from four paired recordings obtained during normal (C) or epileptic (D) SM oscillations. (E) Three-dimensional reconstruction of the two recorded neurons. Note that they are not directly connected. Abbreviations: ipsi, ipsilateral; contra, contralateral.
Fig. 8
Fig. 8. Dual extracellular recordings of a CT neuron with either a TC (A1–A3,D) or a TRN (B1–B3,E) cell during spontaneous SWDs
(A2,B2) Five superimposed, successive, recordings of SW-related action potential discharges. (A3,B3) Cross-correlograms (2 msec resolution) computed from pair recordings. (C) Means and S.D. of the time relationship between the CT, TC and TRN action potential discharges and the SW complex (CT: −19.4 ± 8.8 msec, 88 SW complexes from four rats: TRN: −11.9 ± 7.3 msec, 108 SW complexes from six rats: TC: −12.6 ± 8.2 msec, 133 SW complexes, seven rats. (D) * indicates the beginning of the CT rhythmic discharge, which starts before both the TC rhythmic firing and the occurrence of the seizure. (E) The CT cell discharges in a rhythmic manner well before the related TRN neuron and before the beginning of the SWD.
Fig. 9
Fig. 9. Intracellular activities of TC (A,C) and TRN (B,D) neurons during spontaneously occurring SWDs in GAERS
The traces in A and B are expanded in C and D, respectively, to show the first intracellular events that are associated with the ‘onset’ of SWDs. Curved arrows indicate rhythmic barrages of EPSPs, which occur just before the beginning of spontaneously occurring SWDs. The horizontal dotted line indicates the action potential threshold (− 58mV) at rest. The action potentials are clipped in C and D. Adapted from (Pinault, 2003).
Fig. 10
Fig. 10. Likely spatio-temporal cellular interactions between related CT, TC and TRN neurons during absence-related-SWD in GAERS
In both non-epileptic control rats and GAERS, at least two types of TC neurons coexist, one of which (TC2) is endowed with a presumed H-current. Note that thalamic, relay and reticular, discharges occur in synchronous, phase-locked manners during the occurrence of an absence-related rhythmic spike-and-wave complex in the cortical surface EEG. Left: SW-related extracellular CT and intracellular TC and TRN activities. From top to bottom: A SW complex (EEG), an extracellular CT discharge, an intracellular TRN discharge, and two typical intracellular TC1 and TC2 discharges. The second TC cell (TC2) exhibits a presumed H-current that coincides with an EPSP barrage. The ramp-shaped depolarization, which includes a presumed Ih, can trigger a low-threshold Ca2+ spike (LTS). In TRN cells, the EPSP barrage can trigger voltage-dependent components (V-components, including a low-threshold Ca2+ potential). Right: Schematic of the anatomical relationships between the three main elements that make up the TC system. Adapted from (Pinault, 2003).
Fig. 11
Fig. 11. Temporal relationship between an absence-related spike-and-wave complex and associated first-order and higher-order thalamic cellular activities in GAERS
Peri-event time histograms of unit activity (bin width 1msec) associated with the spike component of the SW complex on the EEG demonstrate activity in first-order (VPM) and higher-order (PC and CL) thalamic nuclei. Note that higher-order nuclei fire after first order thalamic nuclei during the SW complex. Trace above histograms shows an averaged spike-wave complex. Abbreviations: CL, centrolateral; PC, paracentral VPM; medial part of the ventral posterior nucleus. Adapted from (Seidenbecher and Pape, 2001).
Fig. 12
Fig. 12. The Ih of GAERS TC cells has a diminished sensitivity to submaximal, near-physiological cAMP pulses, but not to saturating concentrations of cAMP
(A,B) Current responses of mature TC cells from a non-epileptic control (NEC) rat (A) and a GAERS (B) to increasing negative test voltages (test voltages −50mV and −110mV are indicated next to the traces) before, and in the continuous presence of, 1mM 8Br-cAMP. Corresponding activation curves, constructed from tail currents evoked at −80mV (see Methods), are shown to the right. Thick lines represent the optimal fit of a Boltzmann curve, with the resulting values for the half-activation voltage (Vhalf) and the slope (s) indicated next to them. Filled and open circles represent values before and during 8Br-cAMP application, respectively. (C) Pooled data for V1/2, for s, and for the current amplitude at −90mV before, and in the continuous presence of 8Br-cAMP (1mM). Except for s, 8Br-cAMP significantly altered all control values. The changes in all three parameters were indistinguishable between mature NEC rat (n = 8) and GAERS (n = 7) TC cells. (D) Responses of Ih to photolytic release of caged cAMP in mature (top row) and young (bottom row) NEC animals and GAERS. Overlay of current responses to 30mV hyperpolarizing voltage steps before and after application of a UV flash in cells perfused with caged cAMP. Holding potential was − 60mV. For clarity, only current relaxations during the hyperpolarizing voltage step are shown; passive responses to the step voltage were blanked. (E) The percentage increase in current response in young and mature NEC animals (young, n = 12; mature, n = 8) and GAERS (young, n = 12; mature, n = 12). (F) Representative tail currents obtained from TC cells in the absence of (control) or during perfusion of the cellular interior with 0.1mM 8Br-cAMP. The same voltage protocol as in A was used, voltage steps applied prior to evoking tail currents are indicated next to the traces, and tails were evoked at −75mV. (G) Concentration-response curve for the effect of 8Br-cAMP on the half-activation voltage. The number of recorded cells is indicated next to the symbols. Fitting of the Hill equation was achieved by fixing the Hill coefficient to 1 (see Methods in Kuisle, 2006), yielding a ~5-fold increase of half maximal concentration of 8Br-cAMP in GAERS. *P < 0.05, ** P <0.01. From (Kuisle et al., 2006).
Fig. 13
Fig. 13. Triple extracellular field potential recordings of somatosensory-related thalamic and cortical sites along with spontaneously occurring SWDs in the surface EEG
The photomicrographs in B (up, dorsal; right, lateral) show large extracellular applications (epicentre indicated by a white asterisk) of dextran biotin amine where extracellular field potential recordings were carried out simultaneously in the somatosensory system, that is, from top to bottom, in layer VI, in the thalamus, and in the thalamic reticular nucleus (TRN). The bandpass was 0.1–6 kHz. (B) Left: evoked potentials following electrical stimulation of the contralateral forepaw. Abbreviations: IC, internal capsule; VPl, ventral posterolateral thalamic nucleus; VPm, ventral posteromedial thalamic nucleus; WM, white matter. Adapted from (Pinault, 2003).
Fig. 14
Fig. 14. TRN neurons discharge in the burst mode almost always before TC neurons during the spontaneous generation of SWD in GAERS
(A,B) Two experiments in which related TC and TRN extracellular activities were simultaneously recorded during the development of a spontaneous SWD in the surface EEG of the related cortex. (A) Arrowheads and * indicate the first TC and TRN bursts and the first three AP occurring at 6Hz, respectively. The curved line indicates a short-lasting episode during which he TRN cell fired rhythmic bursts at ~15Hz. Adapted from (Pinault et al., 2001).
Fig. 15
Fig. 15. Overview of the corticocortical (black arrows) and corticothalamic (gray arrows) interdependencies during spontaneous absence seizures in WAG/Rij rats as established by nonlinear association analyses
The thickness of the arrows represents the strength of the association, while the direction of the arrowhead points toward the lagging site. (A) The first 500 msec of the seizure. A cortical focus was found in the upper lip and nose area (perioral region, parietal 2) of the somatosensory cortex, as this site consistently led the other cortical recording sites. The hind paw area was found to lag by 2.9 msec with respect to this focal site. Concerning the corticothalamic interrelationships, the cortical focus led the thalamic ventroposterior medial nucleus with a delay of 8.1msec. (B) The whole seizure. The same cortical focus as during the first 500msec was found consistently. Compared with the first 500msec, the time delay from the cortical focus to the nonfocal cortical sites increases and the direction of the corticothalamic couplings changes. Adapted from (Meeren et al., 2005).

Similar articles

Cited by

References

    1. Archer JS, Abbott DF, Waites AB, Jackson GD. fMRI “deactivation” of the osterior cingulate during generalized spike and wave. Neuroimage. 2003;20:1951–1922. - PubMed
    1. Avanzini G, de Curtis M, Panzica F, Spreafico R. Intrinsic properties of nucleus reticularis thalami neurones of the rat studied in vitro. Journal of Physiology (London) 1989;416:111–122. - PMC - PubMed
    1. Avoli M, Gloor P. Role of the thalamus in generalized penicillin epilepsy: observations on decorticated cats. Experimental Neurology. 1982;77:386–402. - PubMed
    1. Avoli M, Gloor P, Kostopoulos G, Gotman J. An analysis of penicillin-induced generalized spike and wave discharges using simultaneous recordings of cortical and thalamic single neurons. Journal of Neurophysiology. 1983;50:819–837. - PubMed
    1. Avoli M, Rogawski MA, Avanzini G. Generalized epileptic disorders: an update. Epilepsia. 2001;42:445–457. - PubMed