. 2011 Sep;9(9):e1001143.
doi: 10.1371/journal.pbio.1001143. Epub 2011 Sep 6.

Pancreatic mesenchyme regulates epithelial organogenesis throughout development

Affiliations

Pancreatic mesenchyme regulates epithelial organogenesis throughout development

Limor Landsman et al. PLoS Biol. 2011 Sep.

Abstract

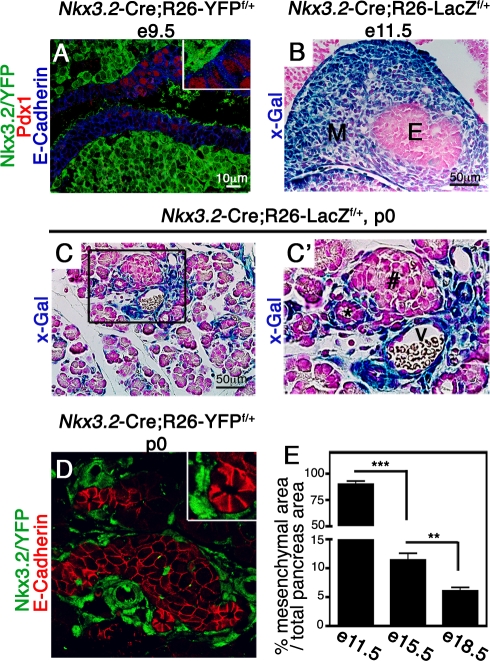
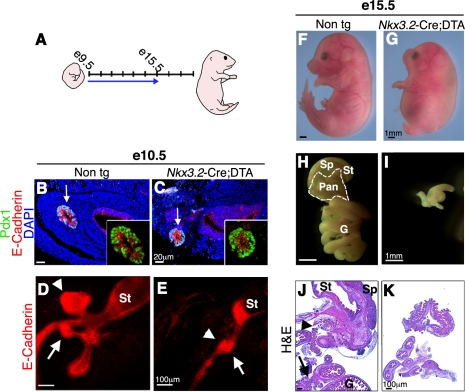
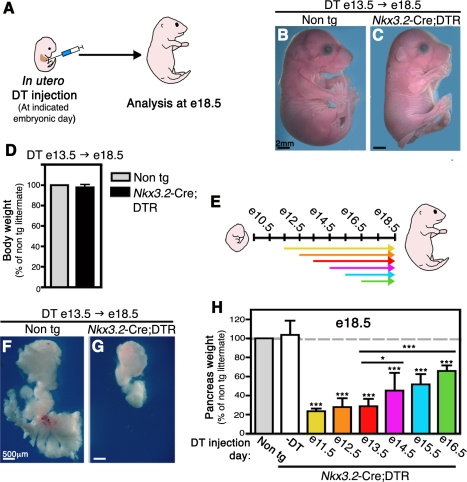
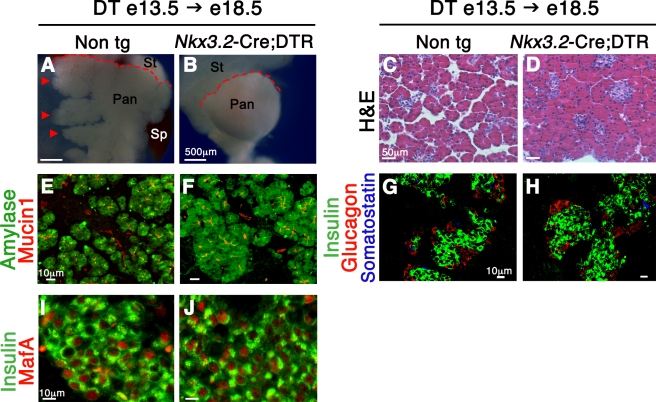
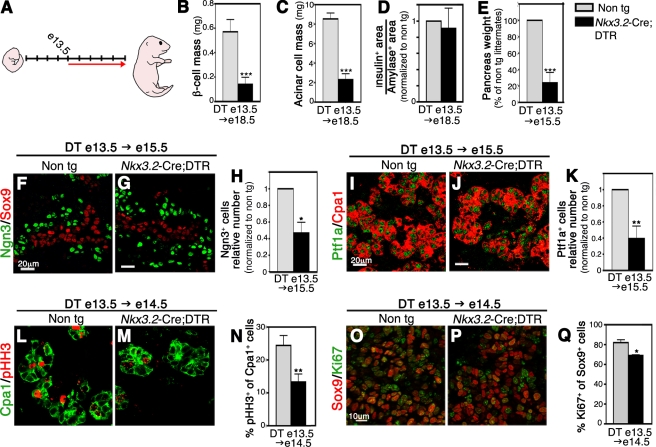
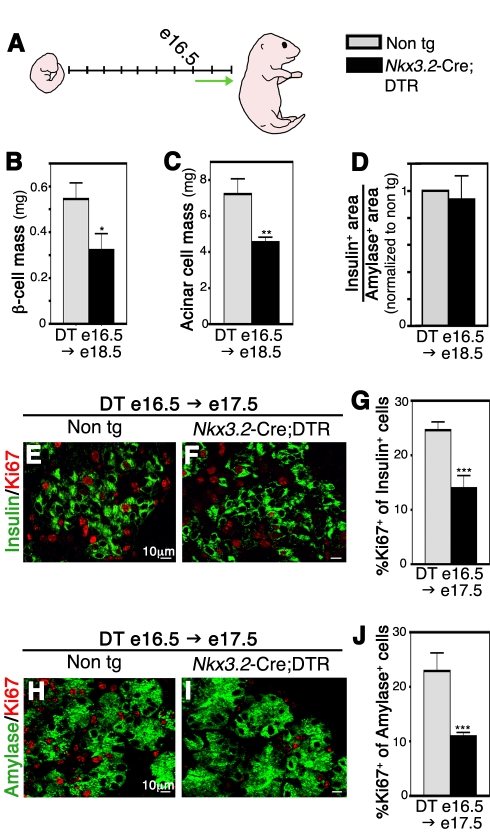
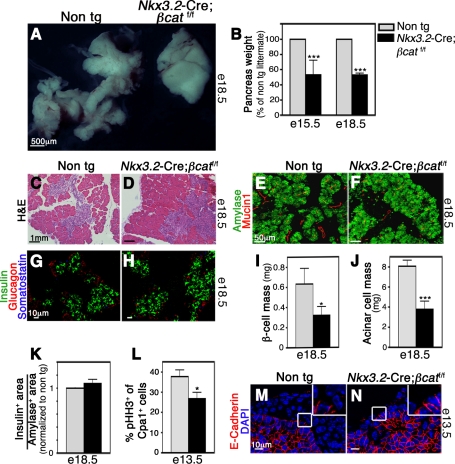
The developing pancreatic epithelium gives rise to all endocrine and exocrine cells of the mature organ. During organogenesis, the epithelial cells receive essential signals from the overlying mesenchyme. Previous studies, focusing on ex vivo tissue explants or complete knockout mice, have identified an important role for the mesenchyme in regulating the expansion of progenitor cells in the early pancreas epithelium. However, due to the lack of genetic tools directing expression specifically to the mesenchyme, the potential roles of this supporting tissue in vivo, especially in guiding later stages of pancreas organogenesis, have not been elucidated. We employed transgenic tools and fetal surgical techniques to ablate mesenchyme via Cre-mediated mesenchymal expression of Diphtheria Toxin (DT) at the onset of pancreas formation, and at later developmental stages via in utero injection of DT into transgenic mice expressing the Diphtheria Toxin receptor (DTR) in this tissue. Our results demonstrate that mesenchymal cells regulate pancreatic growth and branching at both early and late developmental stages by supporting proliferation of precursors and differentiated cells, respectively. Interestingly, while cell differentiation was not affected, the expansion of both the endocrine and exocrine compartments was equally impaired. To further elucidate signals required for mesenchymal cell function, we eliminated β-catenin signaling and determined that it is a critical pathway in regulating mesenchyme survival and growth. Our study presents the first in vivo evidence that the embryonic mesenchyme provides critical signals to the epithelium throughout pancreas organogenesis. The findings are novel and relevant as they indicate a critical role for the mesenchyme during late expansion of endocrine and exocrine compartments. In addition, our results provide a molecular mechanism for mesenchymal expansion and survival by identifying β-catenin signaling as an essential mediator of this process. These results have implications for developing strategies to expand pancreas progenitors and β-cells for clinical transplantation.


Conflict of interest statement

The authors have declared that no competing interests exist.

Figures

Figure 1
Figure 1. Nkx3.2-Cre drives gene expression in the embryonic pancreatic mesenchyme.
(A) e9.5 Nkx3.2-Cre;R26-YFPflox/+ embryos were stained with antibodies against YFP (green), Pdx1 (red), and E-Cadherin (blue). YFP positive cells surround both the dorsal and ventral pancreatic epithelia and do not co-stain with the epithelial markers Pdx1 and E-Cadherin. Insert shows higher magnification of E-Cadherin+Pdx1+ and YFP+ cells (B,C,C′) Nkx3.2-Cre;R26-LacZf/+ embryos stained with X-gal (blue) and counterstained with Fast Red (pink). (B) LacZ positive cells were found in the mesenchymal but not in the epithelial layer of the e11.5 pancreatic bud (B) and p0 pancreatic tissue (C, C′). (C′) A higher magnification of the areas marked with a box in (C). (D) p0 pancreatic tissues of Nkx3.2-Cre;R26-YFPf/+ stained for YFP (green) and E-Cadherin (red) to reveal clear separation between Nkx3.2/YFP+ cells and E-Cadherin+ epithelial cells. (E) Bar diagram shows the mesenchyme area as a percentage of total pancreatic area at the indicated days. Nkx3.2-Cre;R26-LacZf/+ e11.5 pancreatic dorsal buds were stained as described in (B) and Nkx3.2-Cre;R26-YFPf/+ e15.5 and e18.5 pancreata were stained for YFP. The portion of Nkx3.2/YFP and Nkx3.2/LacZ areas were then measured as described in the Materials and Methods. n = 3. M, mesenchyme; E, endodermal epithelium; #, islet of Langerhans; *, duct; V, blood vessel. p values: **p<0.01, ***p<0.005.
Figure 2
Figure 2. Depletion of pancreatic mesenchyme in Nkx3.2-Cre;DTA embryos inhibits epithelial growth.
(A) A scheme illustrating embryonic development from e9.5 to e18.5. Arrow marks the time from the onset of mesenchymal Diphtheria Toxin A subunit (DTA) expression in pancreas to the time of analysis. (B–E) Analysis of e10.5 Nkx3.2-Cre;DTA embryos and non-transgenic littermates. (B,C) Pancreatic bud stained for Pdx1 (green), E-Cadherin (red), and DAPI (blue). The E-Cadherin mesenchymal layer completely surrounds Pdx1+E-Cadherin+ epithelial cells (marked with arrow) in control (B) but not in transgenic embryos (C). Inserts show higher magnification of the epithelial bud. (D,E) Whole mount staining against E-Cadherin marks pancreatic dorsal (arrowhead) and ventral (arrow) buds that are both smaller in transgenic embryos (E) as compared to control (D). St, Stomach. (F–K) Analysis of e15.5 Nkx3.2-Cre;DTA embryos and non-transgenic littermates. (F,G) Images show skeletal abnormalities in transgenic embryos (G) as compared to controls (F). (H–K) Gross morphology and histological analysis of embryonic gastrointestinal tract. (H,I) Isolated whole gastrointestinal tract. (J,K) Cross-sections stained with Hematoxylin and Eosin (H&E). Pancreatic tissue (Pan, outlined with a white dashed line in H and with arrows in J), stomach (St), spleen (Sp), and gut (G) are detected in control (H,J) but only indeterminate gut-like structures are found in transgenic (I, K) embryos.
Figure 3
Figure 3. Pancreatic mesenchyme depletion at various developmental stages impairs organ development.
Nkx3.2-Cre;DTR and non-transgenic littermates embryos were injected i.p. with a single dose of Diphtheria Toxin (DT) (8 ng/mg body weight) while in utero at indicated embryonic days. Embryos were then allowed to develop in situ until analyzed at e18.5, as illustrated in (A). (B–D) Embryos were injected with DT at e13.5 and analyzed at e18.5. (B,C) Whole body images reveal no gross defects in transgenic embryo (C) as compared to control littermate (B). (D) Body weight of transgenic (black bar) to non-transgenic (non tg, gray bar, set to 100%) littermates is equivalent. n = 5. (E) A scheme illustrating embryonic development from e9.5 to e18.5. Arrows mark the time between in utero DT injection to the day of analysis (e18.5). Different arrow colors represent different injection days. (F,G) Imaging of whole e18.5 pancreata, injected with DT at e13.5, reveals profound loss of pancreas tissue in DT transgenic embryos (G). (H) Bar diagram summarizing the relative pancreatic weight at e18.5 of Nkx3.2-Cre;DTR embryos either uninjected (-DT, empty bar) or DT-injected at e11.5 (yellow bar), e12.5 (orange bar), e13.5 (red bar), e14.5 (magenta bar), e15.5 (blue bar), or e16.5 (green bar). Non-transgenic littermates injected with DT at the corresponding days serve as controls (non tg, gray bar, set to 100%). Pancreas weight of uninjected transgenic embryos is comparable to control, whereas DT-injected transgenic pancreata weighed significantly less at all time points analyzed. n>5 for each group (from at least two independent litters). Student t test was used to compare the average weight of transgenic pancreata to non-transgenic littermates as well as to those injected with DT at e13.5 (indicated by horizontal lines). p value: *p<0.05, ***p<0.0001.
Figure 4
Figure 4. Depletion of pancreatic mesenchyme affects epithelial branching, but not cell differentiation.
Morphological and histological analysis of Nkx3.2-Cre;DTR and non-transgenic littermates (non tg) in utero injected with DT at e13.5 and analyzed at e18.5. (A,B) Imaging of dorsal pancreata shows abnormal gross morphology of transgenic tissue (B). Typical left branches (arrowhead) found in non-transgenic pancreas are absent from the DT-treated transgenic tissue. In addition, DT-treated non-transgenic control present with an anvil-shaped tail, while transgenic pancreas have a rounded tail (red dashed lines). Pan, pancreas; St, stomach; Sp, spleen. (C,D) Histological analysis of pancreatic sections stained with H&E indicates abnormal and more condensed cellular distribution in transgenic pancreata (D), as compared to non-transgenic control (C). (E,F) Analysis for the acinar marker Amylase (green) and duct cell marker Mucin1 (red) reveals the presence of these two cell types in treated transgenic pancreata (F), similar to control (E). (G,H) Pancreatic sections were stained with antibodies against Insulin (green) as a β-cell marker, Glucagon (red) as a α-cell marker, and Somatostatin (blue) as δ-cell marker. Islet-like structures containing all these three endocrine cell types are found in the DT-treated transgenic embryos (H), similar to control (G). (I,J) Analysis for MafA (red) expression in β-cells (insulin+ cells, green) indicating normal cell maturation in transgenic pancreata (J).
Figure 5
Figure 5. Mesenchymal ablation at e13.5 leads to reduced β- and acinar-cell mass due to impaired proliferation of precursor cells.
Nkx3.2-Cre;DTR embryos and non-transgenic (non tg) littermates were injected with DT at e13.5 and analyzed at the embryonic days indicated. (A) A scheme illustrating embryonic development from e9.5 to e18.5. Red arrow marks the time from DT injection (e13.5) to analysis endpoint (e18.5). (B) Bar diagram shows marked reduction in β-cell mass in transgenic pancreata at e18.5 (black bar) compared to control tissue (gray bar). β-cell mass was calculated as the fraction of Insulin+ area out of the total pancreatic area multiplied by gross pancreatic mass. n = 3. (C) Analysis of acinar cells at e18.5 indicates a significant loss of acinar mass in transgenic pancreata (black bar). Acinar cell mass was calculated as described above for β-cell mass. n = 3. (D) Bar diagram depicting similar ratios between β (insulin+) and acinar (amylase+) -cell areas in transgenic samples (black bar) and control embryos (gray bar) at e18.5. Amylase+ and Insulin+ areas were calculated for each embryo (as described in the Material and Methods), and the Insulin+ area was divided by the Amylase+ area to obtain the relative ratio between the two components. For clarity, the ratios were normalized to those obtained from non-transgenic controls, which were set to “1.” n = 3. (E) Pancreatic weight of e15.5 embryos injected with DT at e13.5. Transgenic embryos (black bar) show reduced pancreatic weight in comparison to non-transgenic control littermates (gray bar, set to 100%). n = 4. (F–H) The number of Neurogenin 3 (Ngn3)-expressing cells is reduced in e15.5 transgenic pancreata. (F,G) Pancreatic tissues from DT injected non-transgenic (F) and Nkx3.2-Cre;DTR (G) embryos were stained for Ngn3 (green) and Sox9 (red), revealing normal expression pattern in the transgenic tissue at e15.5. (H) Ngn3-expressing cells were counted and their numbers were normalized to that found in non-transgenic pancreata. Number of Ngn3+ cells in Nkx3.2-Cre;DTR pancreata (black bar) was reduced by 50% when compared to non-transgenic littermates (non-tg, gray bar; total number of Ngn3+ cells was set to “1”). n = 3. (I–K) Reduced number of Ptf1a+ cells in transgenic pancreata. DT-treated non-transgenic (I) and transgenic (J) pancreata were stained for Ptf1a (green) and Cpa1 (red). (K) The number of Ptf1a+ cells in transgenic embryos (black bar) was reduced significantly by 40% when normalized to controls (non-tg, gray bar; total number of Ptf1a+ cells was set to “1”). n = 3. (L–N) Measurement of Cpa1+ cell proliferation demonstrates reduced rates in transgenic pancreata. e14.5 pancreatic tissues were stained against Cpa1 (green) and phosphorylated Histone H3 (pHH3, red) (L,M), and the percentage of Cpa1+pHH3+ cell as part of the Cpa1+ cell population was counted (N). Cpa1+ cells in transgenic pancreata (black bar) showed decreased proliferation as compared to non-transgenic control (non-tg, gray bar). n = 3. (O–Q) Reduced proliferation rate of Sox9+ precursor cells in transgenic embryos. e14.5 pancreatic tissues were stained against Sox9 (red) and Ki67 (green) (O,P). The percentage of proliferating Sox9+Ki67+ cells as part of the Sox9+ cell population (black bar) was reduced when compared to non-transgenic controls (non-tg, gray bar) (Q). n = 3. p value: *p<0.05, **p<0.01, ***p<0.005.
Figure 6
Figure 6. Mesenchymal depletion toward the end of gestation impairs acinar and β-cell proliferation.
Nkx3.2-Cre;DTR and non-transgenic littermates were injected with DT in utero at e16.5 and analyzed at indicated embryonic days. (A) A scheme illustrating embryonic development from e9.5 to e18.5. Green arrow marks the time from DT injection (e16.5) to analysis endpoint (e18.5). (B) Analysis for β-cell mass (as described for Figure 5) at e18.5 shows significant reduction in transgenic pancreata (black bar) compared to controls (non-tg, gray bar). n = 3. (C) Bar diagrams show reduced acinar cell (as described for Figure 5) mass at e18.5 in transgenic pancreata (black bar) compared to non-transgenic littermates (non-tg, gray bar). n = 3. (D) β- to acinar-cell ratio is similar in transgenic and non-transgenic controls. Bar diagram presents the normalized ratio between β- and acinar-cell area at e18.5, as described for Figure 5. n = 3. (E–G) Reduced β-cell proliferation in transgenic pancreata (F,G, black bars) as compared to controls (E,G, gray bars). E17.5 pancreatic tissues were stained against Insulin (green) and Ki67 (red), and the percentage of double positive cell within the Insulin+ cell population was counted. n = 3. (H–J) Reduced Acinar cell proliferation in transgenic embryos (I,J, black bars) compared to control embryos (H,J, gray bars). (H,I) e17.5 pancreatic tissues stained against Amylase (green) and Ki67 (red). The percentage of Amylase+Ki67+ cell as part of the Amylase+ cell population was counted (J). n = 3. p value: *p<0.05, **p<0.01, ***p<0.005.
Figure 7
Figure 7. Elimination of mesenchymal Wnt signaling impairs pancreas formation.
Pancreatic tissues from Nkx3.2-Cre;βcat f/f and non-transgenic (non-tg) littermates were analyzed at indicated time points. (A) Gross morphology shows smaller transgenic pancreas (right) with aberrant branching morphology. (B) Reduced pancreatic mass in e15.5 and e18.5 mutant embryos (black bars) as compared to non-transgenic littermates (non-tg, gray bars). For clarity, pancreatic mass in control mice was set to 100%. n = 5. (C,D) Histological analysis of pancreatic sections stained with H&E reveals abnormal tissue morphology in e18.5 mutant embryos (D) when compared to control (C). (E,F) Amylase+ (green) acinar cells and Mucin1+ (red) duct cells can be found in mutant pancreata at e18.5 (F). (G,H) Endocrine cells are present and express mature markers in e18.5 mutant pancreata (H), similar to control (G). Tissues were stained with antibodies against Insulin (green), Glucagon (red), and Somatostatin (blue). (I) Reduced β-cell mass (quantification described in Figure 5) in e18.5 mutant pancreata (black bar) as compared to control (gray bar). n = 3. (J) Reduced Acinar cell mass (quantification described in Figure 5) in mutant pancreata at e18.5 (black bar) as compared to non-transgenic littermates (gray bar). n = 3. (K) The ratio between β- and acinar cell areas (as described in Figure 5) at e18.5 is maintained in mutant pancreata (black bar) when compared to non-transgenic littermates (gray bar, set to “1”). n = 3. (L) Decreased proliferation of Cpa1+ precursor cells in mutant pancreata at e13.5. Bar diagram shows the percentage of pHH3+Cpa1+ cells out of the whole Cpa1+ population in mutants (black bar) and non-transgenic pancreata (gray bar). n = 3. (M,N) e13.5 pancreatic tissue stained with E-Cadherin (red) and counter-stained with DAPI (blue) shows absence of E-Cadherin mesenchymal cells in mutant tissues (N). Inserts represent higher magnification of the areas marked with white frames. p values: *p<0.05, **p<0.01, ***p<0.005.

Similar articles

Cited by

References

    1. Gittes G. K. Developmental biology of the pancreas: a comprehensive review. Dev Biol. 2009;326:4–35. - PubMed
    1. Puri S, Hebrok M. Cellular plasticity within the pancreas–lessons learned from development. Dev Cell. 2010;18:342–356. - PMC - PubMed
    1. Golosow N, Grobstein C. Epitheliomesenchymal interaction in pancreatic morphogenesis. Dev Biol. 1962;4:242–255. - PubMed
    1. Puri S, Hebrok M. Dynamics of embryonic pancreas development using real-time imaging. Dev Biol. 2007;306:82–93. - PMC - PubMed
    1. Li Z, Manna P, Kobayashi H, Spilde T, Bhatia A, et al. Multifaceted pancreatic mesenchymal control of epithelial lineage selection. Dev Biol. 2004;269:252–263. - PubMed

Publication types

MeSH terms

Substances