. 2011 Sep;7(9):e1002129.
doi: 10.1371/journal.pcbi.1002129. Epub 2011 Sep 1.

A systems biology approach identifies molecular networks defining skeletal muscle abnormalities in chronic obstructive pulmonary disease

Affiliations

A systems biology approach identifies molecular networks defining skeletal muscle abnormalities in chronic obstructive pulmonary disease

Nil Turan et al. PLoS Comput Biol. 2011 Sep.

Abstract

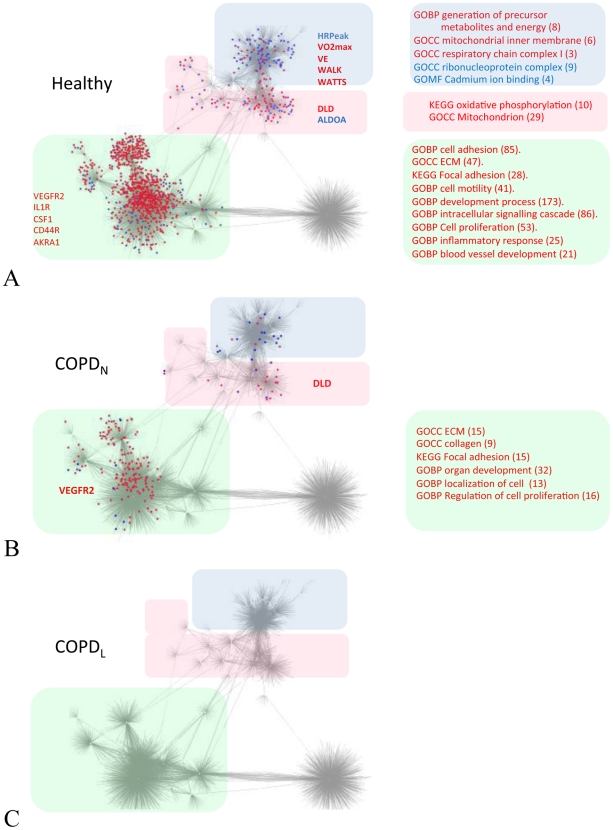
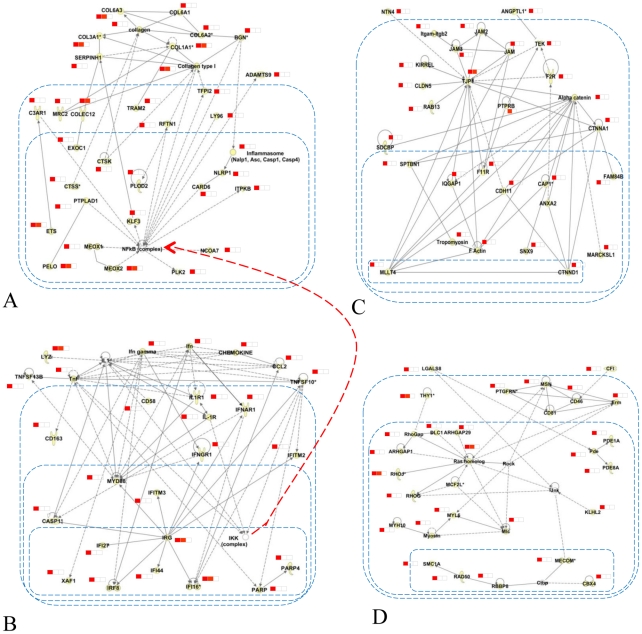
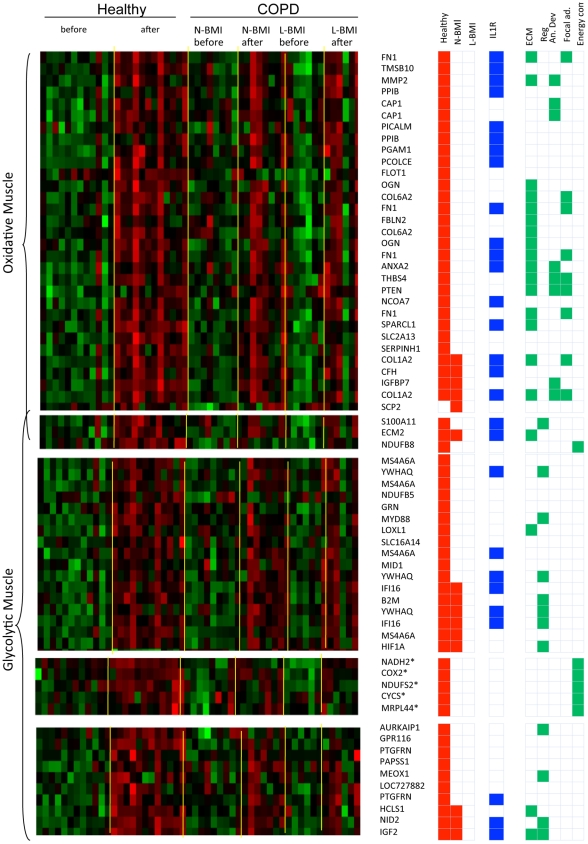
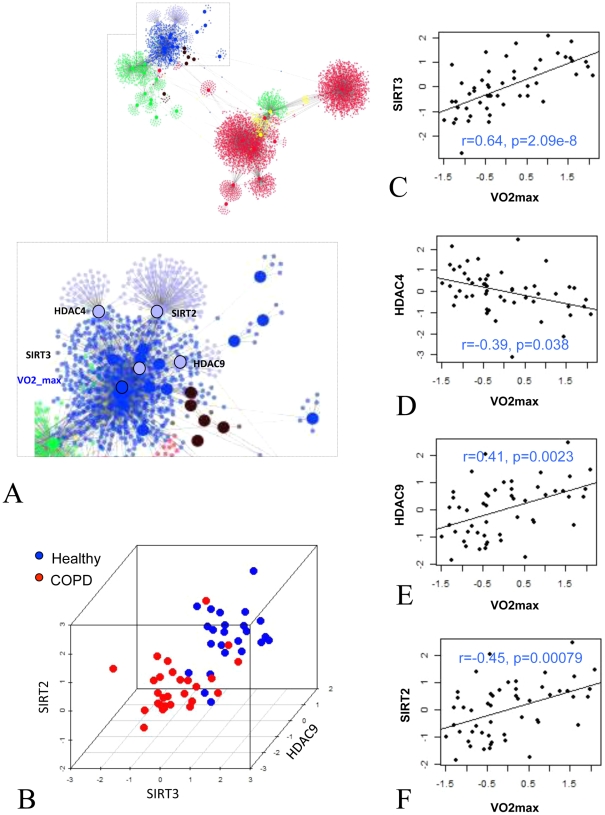
Chronic Obstructive Pulmonary Disease (COPD) is an inflammatory process of the lung inducing persistent airflow limitation. Extensive systemic effects, such as skeletal muscle dysfunction, often characterize these patients and severely limit life expectancy. Despite considerable research efforts, the molecular basis of muscle degeneration in COPD is still a matter of intense debate. In this study, we have applied a network biology approach to model the relationship between muscle molecular and physiological response to training and systemic inflammatory mediators. Our model shows that failure to co-ordinately activate expression of several tissue remodelling and bioenergetics pathways is a specific landmark of COPD diseased muscles. Our findings also suggest that this phenomenon may be linked to an abnormal expression of a number of histone modifiers, which we discovered correlate with oxygen utilization. These observations raised the interesting possibility that cell hypoxia may be a key factor driving skeletal muscle degeneration in COPD patients.


Conflict of interest statement

The authors have declared that no competing interests exist.

Figures

Figure 1
Figure 1. Network integrating multi-level measurements in the 8 weeks training study.
The figure shows the network representing the relationship between physiological measurements, serum cytokine levels and mRNA expression profiles in the muscle, following ARACNE analysis of the 8 weeks training dataset. Panel A shows an outline of the network topology where individual network hubs have been annotated. Red nodes represent genes coding for receptors for growth factors and immune system mediators, blue nodes represent physiological measurements, brown nodes represent serum cytokines, and green nodes represent gene expression of enzymes in the glycolysis and gluconeogenesis pathways. Panel B shows all nodes in the network (representing 16350 genes or measurements). The colour of nodes follows the same code as panel A. In addition yellow nodes represent genes in common between cytokine and growth factor and glycolysis/gluconeogenesis network hubs.
Figure 2
Figure 2. Healthy and COPD specific networks.
The figure shows interaction networks built using solely expression profiling data representing healthy (panels A and B) or COPD (panels C and D) muscle biopsy mRNA profiles. For comparison with Figure 1, the network representing integrated healthy and COPD samples has been represented in Panels E and F. Figure layout and the colour coding are identical to Figure 1.
Figure 3
Figure 3. Training response of healthy and COPD individuals visualized on the integrated 8 weeks training network.
The networks represent the genes up-regulated (marked in red) and down-regulated (marked in blue) mapped on to the interaction map inferred using the 8 weeks training multi-measurement dataset (shown in detail in Figure 1 ). Panel A shows genes differentially regulated after training in healthy individuals. Panel B shows genes differentially expressed after training in N-BMI COPD patients. Network hubs representing genes up-regulated (red) or down-regulated (blue) are listed on the side of the relevant sub-networks. The drastic reduction in the molecular response to training associated with the cytokine and bioenergetics clusters is evident. Panel C shows the lack of response to training in COPDL patients.
Figure 4
Figure 4. Ingenuity networks regulated by endurance training.
This figure shows the most important findings derived from Ingenuity analysis using genes that are differentially expressed in response to training in healthy individuals and connected to receptor hubs in the previously inferred network. Panel A and Panel B represent two interconnected networks linked the transcription of several cytokines (IL1, TNFα, IFNγ, CCL2) and activation of the NF-kB complex (Panel A), leading to the activation of several NF-kB targets related to connective tissue formation (Panel B). Panel C shows the relationship between upregulation of gap junction complexes (JAM, JAM2, JAM3 and TJP1) and activation of important structural components of muscle fibres (e.g. tropomyosin). Panel D shows the important functional link between activation of several Rho GTPases and muscle development, represented by genes encoding for a component of the hexameric ATPase cellular motor protein myosin (MYL5) and MYH10.
Figure 5
Figure 5. Effects of IL-1β in mouse glycolytic and oxidative muscles.
This figure describes the effects of recombinant interleukin 1 on the transcriptional state of glycolytic and oxidative muscles. Panel A represents the heatmap of expression profiles in human muscle biopsies of genes that are differentially regulated in response to training in humans and also induced by IL1β in mouse muscles. Panel B shows the localisation of genes up-regulated in oxidative and glycolytic muscles on the COPD interaction network represented in Figure 1.
Figure 6
Figure 6. Expression of chromatin modification enzymes in COPD and healthy muscles.
Panel A represent the close localization of histone deacetylase enzymes to VO2max in the inferred network. Panel B is a 3D plot representing the expression of histone deacetylase enzymes and the separation between disease and healthy muscles. Panel C, D, E and F represent the scatterplots between VO2max and the expression of histone deacetylase enzymes.
Figure 7
Figure 7. Genes represented in the neighborhood of VO2max are transcriptionally regulated in a mouse model of hypoxia.
This heatmap represent the expression of genes in the neighborhood of VO2max that are also differentially expressed in skeletal muscles, in a mouse model of hypoxia. It shows that the majority of these genes (82%) are regulated in the direction predicted by the network we developed (Figure 1). The HDAC4 and SIRT3 genes are among these and are highlighted in red. Genes that are not modulated in the direction we predicted are shaded in grey.

Similar articles

Cited by

References

    1. Hogg JC, Chu F, Utokaparch S, Woods R, Elliott WM, et al. The nature of small-airway obstruction in chronic obstructive pulmonary disease. N Engl J Med. 2004;350:2645–2653. - PubMed
    1. Cosio MG, Saetta M, Agusti A. Immunologic aspects of chronic obstructive pulmonary disease. N Engl J Med. 2009;360:2445–2454. - PubMed
    1. Murray CJ, Lopez AD. Alternative projections of mortality and disability by cause 1990–2020: Global burden of disease study. Lancet. 1997;349:1498–1504. - PubMed
    1. Pauwels RA, Buist AS, Calverley PM, Jenkins CR, Hurd SS, et al. Global strategy for the diagnosis, management, and prevention of chronic obstructive pulmonary disease. nhlbi/who global initiative for chronic obstructive lung disease (gold) workshop summary. Am J Respir Crit Care Med. 2001;163:1256–1276. - PubMed
    1. Rabe KF, Hurd S, Anzueto A, Barnes PJ, Buist SA, et al. Global strategy for the diagnosis, management, and prevention of chronic obstructive pulmonary disease: Gold executive summary. Am J Respir Crit Care Med. 2007;176:532–555. - PubMed

Publication types

MeSH terms