. 2011 Sep;7(9):e1002197.
doi: 10.1371/journal.ppat.1002197. Epub 2011 Sep 1.

Plasmodium protease ROM1 is important for proper formation of the parasitophorous vacuole

Affiliations

Plasmodium protease ROM1 is important for proper formation of the parasitophorous vacuole

Iset Medina Vera et al. PLoS Pathog. 2011 Sep.

Abstract

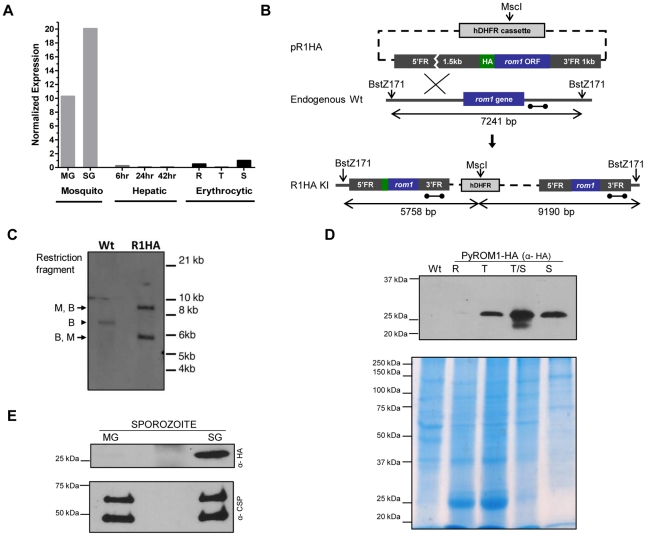
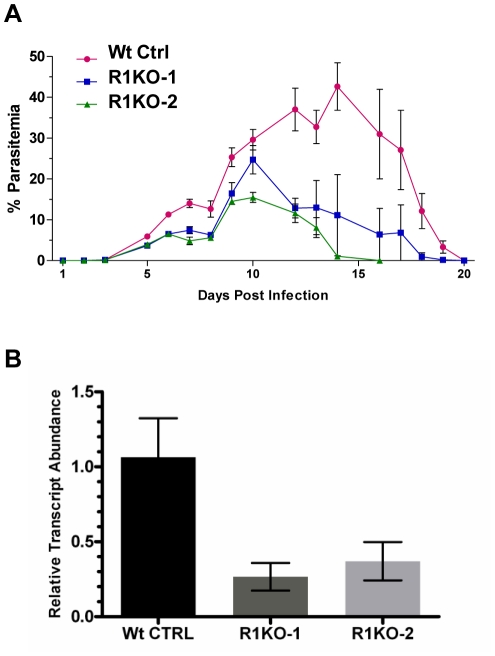
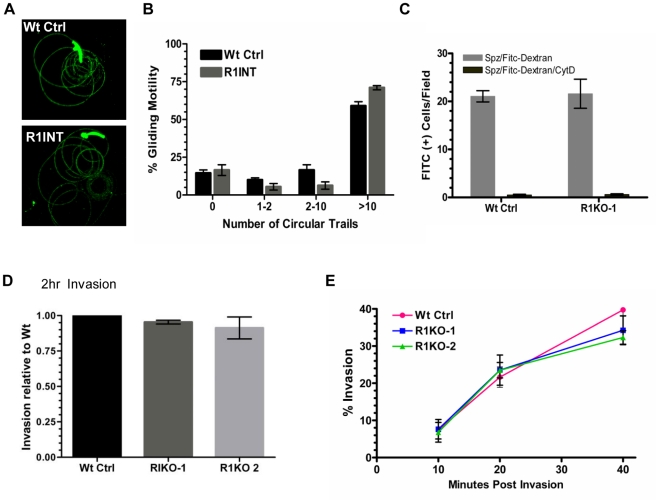
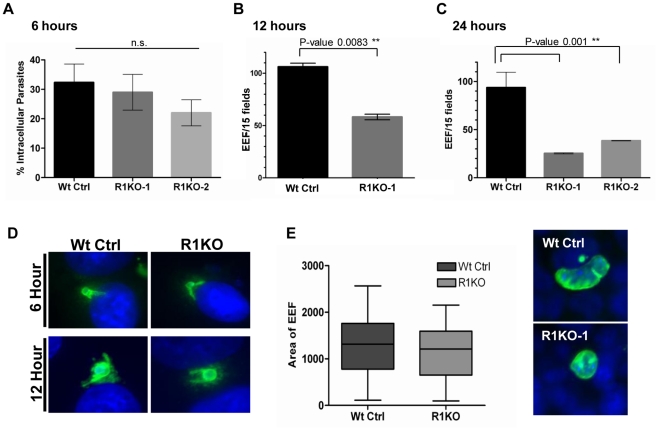
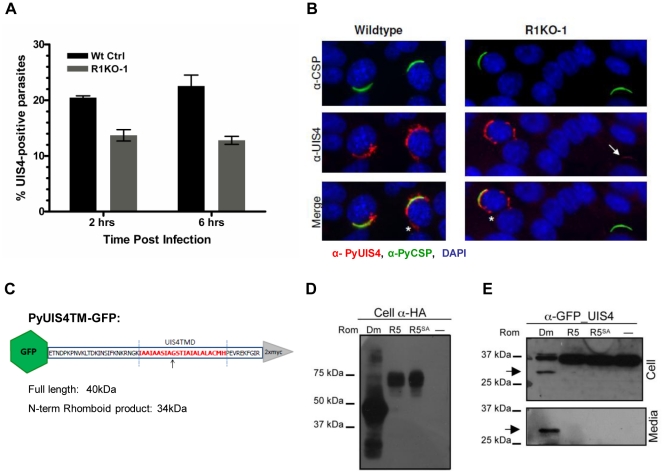
Apicomplexans are obligate intracellular parasites that invade host cells by an active process leading to the formation of a non-fusogenic parasitophorous vacuole (PV) where the parasite replicates within the host cell. The rhomboid family of proteases cleaves substrates within their transmembrane domains and has been implicated in the invasion process. Although its exact function is unknown, Plasmodium ROM1 is hypothesized to play a role during invasion based on its microneme localization and its ability to cleave essential invasion adhesins. Using the rodent malaria model, Plasmodium yoelii, we carried out detailed quantitative analysis of pyrom1 deficient parasites during the Plasmodium lifecycle. Pyrom1(-) parasites are attenuated during erythrocytic and hepatic stages but progress normally through the mosquito vector with normal counts of oocyst and salivary gland sporozoites. Pyrom1 steady state mRNA levels are upregulated 20-fold in salivary gland sporozoites compared to blood stages. We show that pyrom1(-) sporozoites are capable of gliding motility and traversing host cells normally. Wildtype and pyrom1(-) sporozoites do not differ in the rate of entry into Hepa1-6 hepatocytes. Within the first twelve hours of hepatic development, however, only 50% pyrom1(-) parasites have developed into exoerythrocytic forms. Immunofluorescence microscopy using the PVM marker UIS4 and transmission electron microscopy reveal that the PV of a significant fraction of pyrom1(-) parasites are morphologically aberrant shortly after invasion. We propose a novel function for PyROM1 as a protease that promotes proper PV modification to allow parasite development and replication in a suitable environment within the mammalian host.


Conflict of interest statement

The authors have declared that no competing interests exist.

Figures

Figure 1
Figure 1. Stage-specific expression of pyROM1 during the malaria life cycle.
(A) Real time PCR using cDNA prepared from synchronized blood stage parasites, mosquito derived parasites, and hepatic stage parasites of P. yoelii 17XNL. Expression levels were normalized to 18s rRNA and calculated relative to the Schizont (S) transcripts, set as 1. Parasite stages are abbreviated as follows: MG, Midgut sporozoites (Day 10); SG, Salivary Gland sporozoites (Day 14); 6, sporozoite development at 6 hours post-invasion; 24, Liver trophozoite development at 24 hours; 42, Liver schizont development at 42 hours; R, Blood stage rings; T, blood stage trophozoite; S, blood stage schizont. (B) Schematic of knock-in strategy using pR1HA construct consisting of the pyrom1 ORF fused to an N-terminal triple HA tag under the control of its 5′ and 3′ regulatory elements. (C) Restriction digest strategy described in (B) was used to test integration of the knock-in construct. Homologous recombination of knock-in construct pR1HA into the pyrom1 locus creates an MscI (M) restriction site that is specific to the hDHFR coding sequence. Restriction sites BstZ171 (B) lie just outside the pyrom1 sequence used in pR1HA knock in vector. Digestion of PyROM1-HA (R1HA) gDNA yields a two fragment restriction pattern (B,M – 5.758 bp; M,B – 9.190 bp) when a probe specific to the 3′ flanking region is used (dumbbell bar). Digestion of wildtype (Wt) gDNA with both enzymes yields a single fragment (B,B – 7241 bp) using the same probe. (D) Western blot analysis of synchronized blood stage parasites using lysates from pyROM1-HA recombinant clone probed with anti-HA antibody reveals a band of the expected size, ∼30 kDa (R: Ring, T: Trophozoite, T/S: late Trophozoite/Schizont, S: Schizont). Mixed blood stages of wildtype parasites were loaded as a negative control (Wt). Saponin-released parasite lysates were loaded at 40 ug per lane to normalize for protein amounts. Coomassie Blue stained gel is shown below Western blot to serve as a loading control (E) Western blot analysis of midgut (MG) and salivary gland (SG) sporozoites from pyROM1-HA knock in parasites probed with anti-HA antibody (100,000 sporozoites/lane). Shown below is the same Western blot probed with anti-PyCSP (2F6) antibody to serve as loading control.
Figure 2
Figure 2. PyROM1 localizes with microneme markers and is not present at the parasite surface during sporozoite invasion.
(A) Immunofluorescence assay of blood stages shows partial co-localization of PyROM1-HA (R1HA) with the microneme protein pyMAEBL and the rhoptry neck marker RON4 in schizont merozoites. PyROM1-HA also partially overlaps the ER marker BiP in schizonts. (B) Immunofluorescence assay of pyROM1-HA (R1HA) salivary gland sporozoites reveals that pyROM1 partially co-localizes with the microneme marker PyMAEBL and with the eTRAMP protein PyUIS4 within diffuse intracellular granules throughout the length of the parasite body. Restricted localization that excludes the area surrounding the nucleus is observed between PyROM1-HA and the ER marker BiP. (C) Localization of pyROM1-HA during invasion into Hepa 1–6 cells. The extracellular portion of parasite stains with CSP. Intracellular localization of pyROM1-HA in a developing EEF at 4 hours post invasion into Hepa 1–6 cells has overlap with CSP.
Figure 3
Figure 3. Generation of pyrom1(-) parasites by allelic exchange.
(A) Schematic of targeting strategy using the targeting vector pR1KO which has the pbDHFR/TS-GFP selection cassette flanked by a 5′homologous arm (600 bp) and a 3′ homologous arm (600 bp) corresponding to the 5′ and 3′ regions of the pyrom1 gene, respectively. After double cross over homologous recombination the endogenous pyrom1 gene is replaced by the selection cassette resulting in parasites deficient for pyrom1 (R1KO). (B) Proper gene replacement was verified by Southern Blot analysis in two knockout clones (KO1, KO2). Strategy for enzyme restriction digestion with either ScaI (S) or a combination of ScaI and MscI (M) using a probe (dumbbell bar) specific for the 3′ homologous arm is depicted in (A). A ScaI fragment that corresponds to the wildtype (Wt) genomic locus migrates at ∼7000 bp in both blots. Digestion of the recombinant locus (R1KO) with either ScaI/MscI or ScaI reveals expected bands migrating at the expected sizes of ∼4000 bp and ∼12,000 bp, respectively. (C) Lack of pyrom1 gene expression in R1KO clones from mixed blood stages was verified by RT-PCR. Analysis of pyADA expression, an unrelated gene, was used as a positive control. Expression of pyrom1 was analyzed using primers, R1-F and R1-R, which amplify the Open Reading Frame (ORF) of pyrom1. The expected pyrom1 ORF band (expected size ∼800 bp) is readily amplified from wildtype (WT) cDNA, but is not amplified from cDNA of the two pyrom1(-) clones (KO-1 and KO-2).
Figure 4
Figure 4. Phenotypic analysis of pyrom1(-) mutant parasite in the mammalian host.
(A) Female Balb/c mice, 6 weeks of age (N = 5) were infected with mixed blood stage parasites from either P. yoelii 17XNL wildtype control (Wt Ctrl) or pyrom1(-) clones R1KO -1 and R1KO-2 by tail intravenous injection with 1×10⁴ iRBC. Percent parasitemia (infected Red Blood Cells/Total Red Blood Cells ± Std) was calculated on a daily basis from Giemsa stained smears counting at least 1000 total Red Blood Cells per smear. Values presented are the mean parasitemia/day from each infected group with the error as the standard deviation. Parasitemia was measured until the mice had cleared the infection. (B) Salivary gland sporozoites (SPZ), 104, were injected intravenously into 6 week Balb/c female mice (N = 5). At 36 hours post infection, whole livers were taken RNA was extracted for quantitative RT-PCR analysis. Liver burdens were determined as the levels of Plasmodium 18S rRNA transcript expression normalized to mouse GAPDH expression levels. Liver burden, defined as the level of parasites in liver based on 18S expression levels, was decreased in the two pyrom1(-) parasite (R1KO-1 and R1KO-2) infected mice relative to mice infected with wildtype (Wt Ctrl) parasites. Fold change was calculated using the ddCt (2−ddCt) method and relative transcript levels are shown.
Figure 5
Figure 5. Pyrom1(-) salivary gland sporozoites have no defect in gliding, traversal, or host cell invasion.
(A) Salivary gland sporozoites from wildtype or the pyrom1 disrupted parasite line (R1INT) were allowed to glide on glass and gliding trails of deposited CSP were stained were visualized under fluorescent microscope (B) Quantification of sporozoite trails was carried out in triplicate and at least 25 fields were counted per well. The number of circular trails were quantified per sporozoite and shown is the mean percentage (± SD) of sporozoites that were associated with 0, 1–2, 2–10, or >10 circular trails. (C) Salivary gland sporozoites were loaded on top of a monolayer of Hepa 1–6 cells in the presence of 1 mg/ml FITC-dextran and allowed to traverse cells. As an internal negative control, sporozoites were treated with the microfilament inhibitor Cytochalasin D (CytD) prior to loading on top of Hepa 1–6 cells. The numbers of FITC-positive cells/field were counted under the microscope. The mean number of fluorescent cells/field (± SD) is shown for a representative. (D) Salivary gland sporozoites were loaded on Hepa1–6 monolayers and allowed to invade for two hours. A double staining assay was carried out to distinguish intracellular versus extracellular parasites. The % invasion was calculated as the number of (Green - Red parasites)/(Green parasites). Values presented are the mean number counts relative to the wildtype control (set to 1) ± standard deviation. (E) Kinetics of invasion was analyzed at three time points (10 min, 20 min, 40 min) during early invasion using the double staining assay described in (D). Y-axis values represent the % invasion of partially invaded or fully invaded parasites ± standard deviation.
Figure 6
Figure 6. Development of pyrom1(-) EEF is significantly reduced within the first 24 hours of hepatic development.
Development of sporozoites within Hepa 1–6 cells was analyzed at 6 hours, 12 hours, and 24 hours post invasion. (A) A double staining assay was carried out to determine the number of intracellular parasites undergoing development inside Hepa1–6 cells at 6 hours post infection The % intracellular parasites was determined by counting at least 30 fields per well. Values shown are the mean % intracellular parasites from duplicate counts ± standard deviation. The values were not statistically significant (P-value 0.17) using unpaired t test analysis. Parasite development at 12 hours (B) and 24 hours (C) post infection was assayed by staining with α-pyCSP and developing parasites per field were counted (at least 30 fields were counted per well). The numbers represented are the mean values of developing parasites/15 fields ± standard deviation. At 12 hours development there is a 45% reduction in pyrom1(-) parasite development (P-value 0.008 using one-way ANOVA analysis) and at 24 hours there is at least a 60% reduction in pyrom1(-) parasite development (P-value 0.001 using one-way ANOVA analysis) D) Images of developing liver stage parasites at 6 hours and 12 hours stained with CSP show that despite reduced numbers, R1KO parasites are capable of undergoing the initial differentiation, transformation, and sphericalization during early hepatic development. (E) Development of pyrom1(-) parasites that survive the initial 24 hours go on to develop normally. Immunofluorescence of exo-erythrocytic forms (EEF) at 40 hours post invasion of Hepa1–6 cells was performed using anti-pyCSP to visualize developing parasites. Pictures of at least 50 EEF/well (duplicate) were taken. Area of EEF was measured using Image J software. Area was determined as an arbitrary value from images taken with the same magnification (40×). Bar graphs represent the mean area ± SEM.
Figure 7
Figure 7. The parasitophorous vacuole protein PyUIS4 is a rhomboid substrate and its association with the PVM is decreased in a fraction of Pyrom1(-) parasites.
(A) Immunofluorescence assay was performed on methanol fixed and permeabilized parasites post hepatocyte invasion at 2 hrs and 6 hrs development. The parasitophorous vacuole membrane (PVM) was detected by staining with α-pyUIS4. Parasites (both extracellular and intracellular) were stained with pyCSP. The percent UIS4-CSP double stained parasites was determined by counting parasites staining with both UIS4 (PVM staining; see B) and CSP and dividing this number by the number of parasites staining with CSP (total parasites including extracellular parasites). Numbers are the average of triplicates ± SEM (at least 300 parasites counted) and were statistically significant using the unpaired t test analysis. (B) Images from experiment in (A) of sporozoites at 2 hours post Hepa1–6 infection showing localization of PyUIS4 (red) within PVM and the associated tubulovesicular network (asterisk) characteristic of intracellular developing parasites versus the speckled UIS4 localization within the sporozoites (white arrow). In the quantification of (A), only parasites with UIS4 PVM staining were counted positive for UIS4. Anti-CSP antibody (green) was used to visualize al parasites (intracellular and extracellular). The nucleus was stained with DAPI (blue). (C) Schematic of PyROM4TMGFP construct displaying the truncated sequence of PyROM4 used to clone into a vector containing an IgK leader sequence, an N-terminal GFP tag (green hexagon), and a C-terminal 2xMyc tag (gray triangle). Dashed blue parallel lines represent the boundaries of the TMD (amino acid sequence in red font color) as predicted by HMMTOP and TMHMM analysis tools (Expasy.org). Arrow depicts the predicted rhomboid cleavage site between an Alanine and a Glycine. Predicted full length size for PyROM4TMGFP is 40 kDa, and the predicted size for the N-terminal rhomboid cleaved product is a 34 kDa. (D and E) Western blot analysis of transiently transfected COS7 cells used to detect proteolytic activity of rhomboid against PyUIS4TMGFP. (D) Western blot of cell lysates probed with anti-HA antibody (Cell α-HA) show proper expression of DmRho-1 (Dm), TgROM5 (TgR5), and TgROM5SA (TgR5SA) in the first three lanes and no detection of protein in the “no rhomboid” (–) negative control in the fourth lane. (E) Processing of PyUIS4TMGFP (anti-GFP_UIS4) was analyzed by western blot of cell lysates (upper panel, Cell) and concentrated media fraction (lower panel, Media) by probing with anti-GFP antibody. Full length PyUIS4GFP is observed in the cell fraction at the expect size of ∼40 kDa. A lower molecular weight product (∼34 kDa) is detected in both cell and media fractions (arrow) only in the first lane where DmRho-1 (Dm) is co-expressed. No cleaved product is seen when PyUIS4TMGFP is co-expressed with TgROM5 (TgR5), TgROM5SA (TgR5SA), and the “no rhomboid” negative control (–).
Figure 8
Figure 8. Ultrastructural analysis of pyrom1(-) parasites reveals an abnormal parasitophorous vacuole.
(A) Representative electron micrograph images of intracellular parasites developing within a Hepa 1–6 host cell at 4 hours post invasion. Inset shows a close up of the boundary between the parasite and the host cell cytoplasm. Notice the expanded PV space appearing like a halo (*) in the wildtype parasite and a tight fitting PVM with reduced PV space in the R1KO parasite. Scale bars are equal to 0.5 µm. Abbreviations: SPZ-sporozoite, hC- Host cell cytoplasm, hN- Host cell nucleus, PVM- Parasitophorous vacuole membrane, PV-Parasitophorous vacuole space, PPM- Parasite Plasma Membrane, IMC- Inner Membrane Complex. (B)) Quantification of PV space area (halo area) and parasite area was carried out using ImageJ software. The ratio of halo area/parasite area ± SEM for Wildtype parasites (Wt Ctrl) was 0.168±0.017 (N = 38) and for R1KO parasites was 0.094±0.013 (N = 44). Statistics was carried out using One-way ANOVA analysis. (C) The graph shows the distribution of the parasite population as a function of the ratio halo area/parasite area between wildtype (Wt Ctrl) and pyrom1(-) (R1KO). A shift in the R1KO population towards a smaller ratio (>0.00 to 0.05) is observed and is denoted by an asterisk (*).

Similar articles

Cited by

References

    1. Greenwood BM, Fidock DA, Kyle DE, Kappe SH, Alonso PL, et al. Malaria: progress, perils, and prospects for eradication. J Clin Invest. 2008;118:1266–1276. - PMC - PubMed
    1. Baum J, Gilberger TW, Frischknecht F, Meissner M. Host-cell invasion by malaria parasites: insights from Plasmodium and Toxoplasma. Trends Parasitol. 2008;24:557–563. - PubMed
    1. Huynh MH, Harper JM, Carruthers VB. Preparing for an invasion: charting the pathway of adhesion proteins to Toxoplasma micronemes. Parasitol Res. 2006;98:389–395. - PubMed
    1. Lebrun M, Michelin A, El Hajj H, Poncet J, Bradley PJ, et al. The rhoptry neck protein RON4 re-localizes at the moving junction during Toxoplasma gondii invasion. Cell Microbiol. 2005;7:1823–1833. - PubMed
    1. Alexander DL, Mital J, Ward GE, Bradley P, Boothroyd JC. Identification of the moving junction complex of Toxoplasma gondii: a collaboration between distinct secretory organelles. PLoS Pathog. 2005;1:e17. - PMC - PubMed

Publication types

MeSH terms