. 2011 Sep;7(9):e1002226.
doi: 10.1371/journal.ppat.1002226. Epub 2011 Sep 1.

The regulated secretory pathway in CD4(+) T cells contributes to human immunodeficiency virus type-1 cell-to-cell spread at the virological synapse

Affiliations

The regulated secretory pathway in CD4(+) T cells contributes to human immunodeficiency virus type-1 cell-to-cell spread at the virological synapse

Clare Jolly et al. PLoS Pathog. 2011 Sep.

Abstract

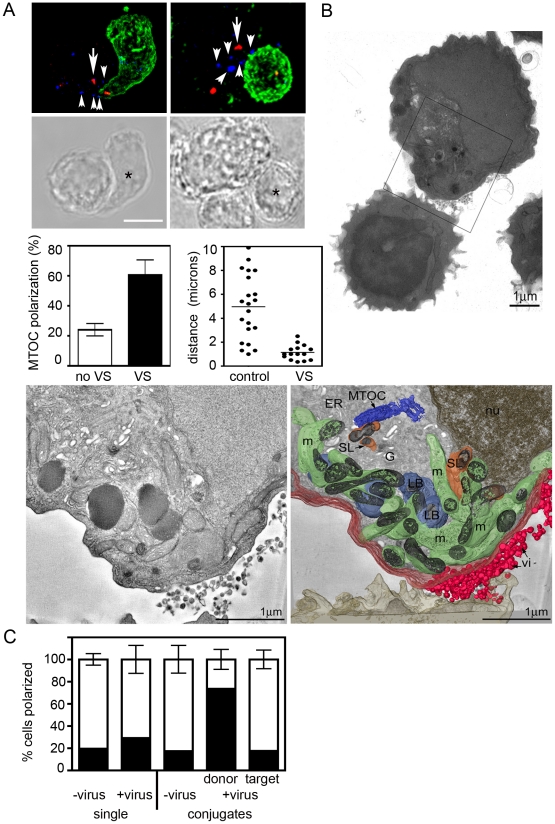
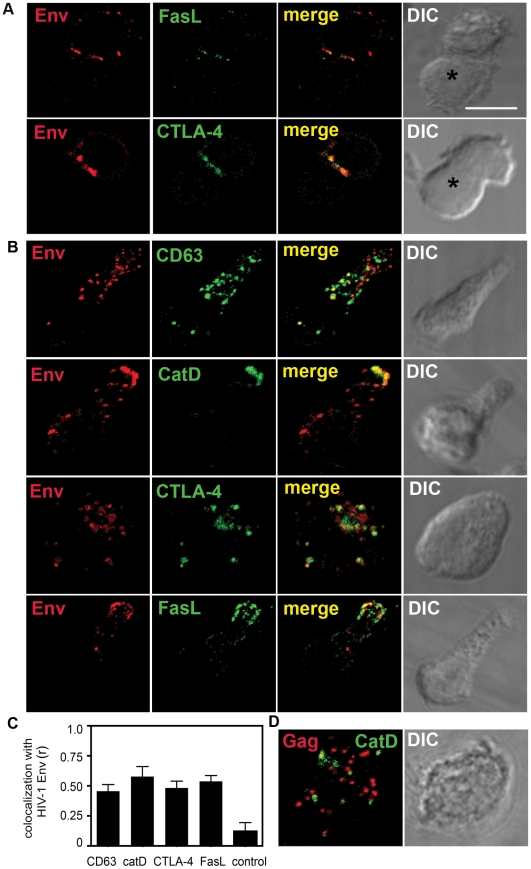
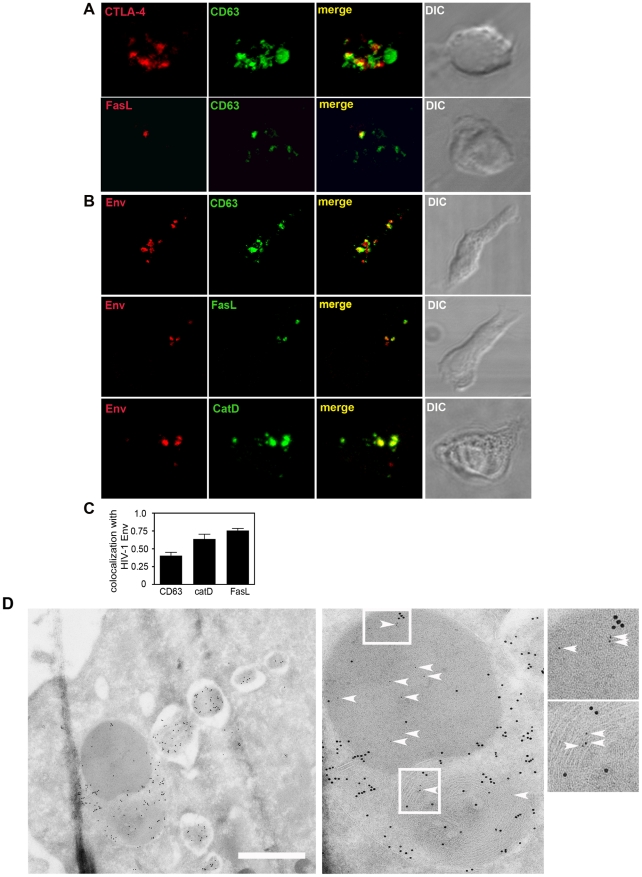
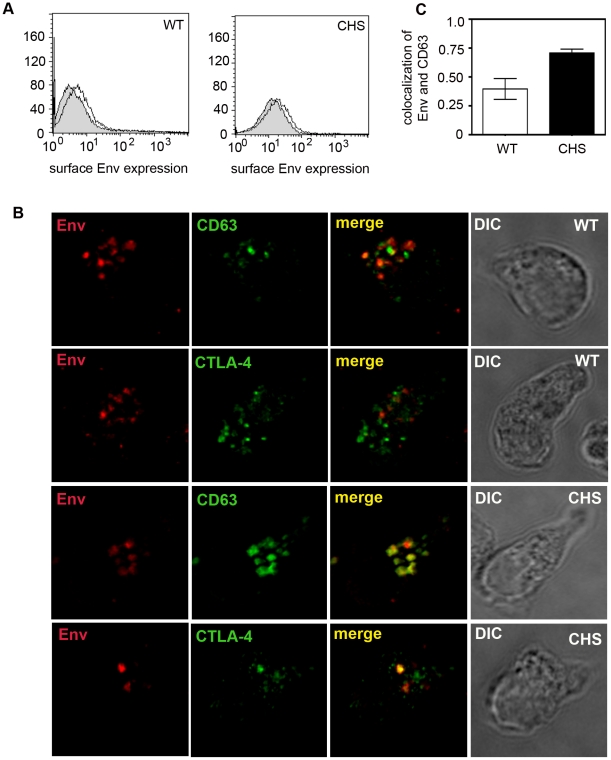
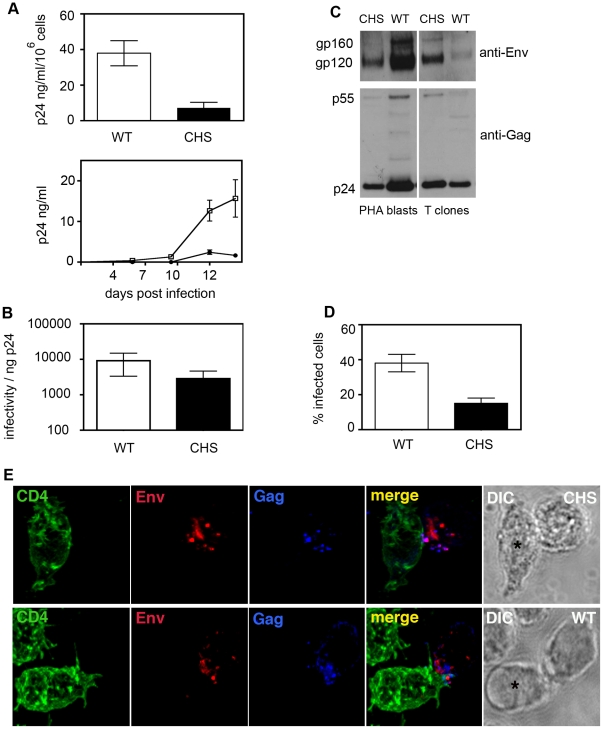
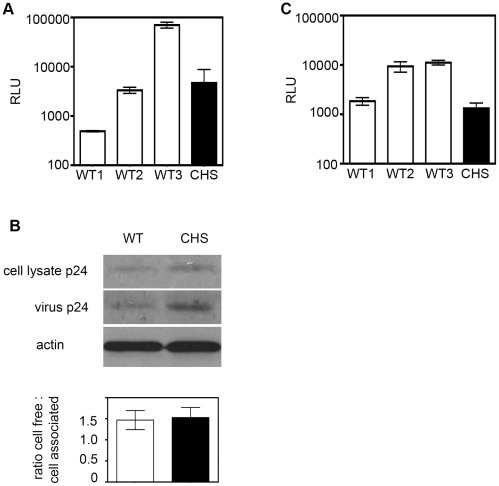
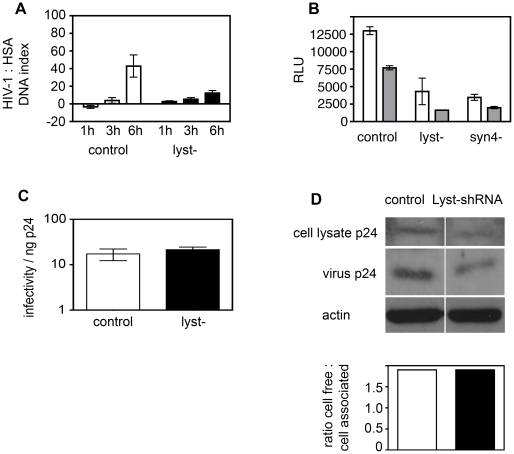
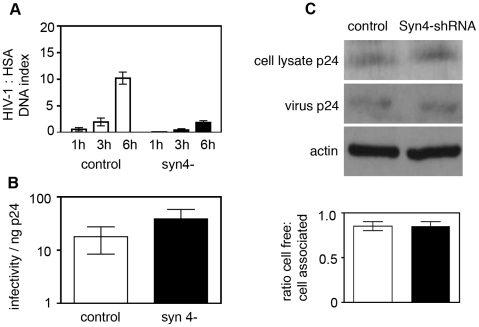
Direct cell-cell spread of Human Immunodeficiency Virus type-1 (HIV-1) at the virological synapse (VS) is an efficient mode of dissemination between CD4(+) T cells but the mechanisms by which HIV-1 proteins are directed towards intercellular contacts is unclear. We have used confocal microscopy and electron tomography coupled with functional virology and cell biology of primary CD4(+) T cells from normal individuals and patients with Chediak-Higashi Syndrome and report that the HIV-1 VS displays a regulated secretion phenotype that shares features with polarized secretion at the T cell immunological synapse (IS). Cell-cell contact at the VS re-orientates the microtubule organizing center (MTOC) and organelles within the HIV-1-infected T cell towards the engaged target T cell, concomitant with polarization of viral proteins. Directed secretion of proteins at the T cell IS requires specialized organelles termed secretory lysosomes (SL) and we show that the HIV-1 envelope glycoprotein (Env) localizes with CTLA-4 and FasL in SL-related compartments and at the VS. Finally, CD4(+) T cells that are disabled for regulated secretion are less able to support productive cell-to-cell HIV-1 spread. We propose that HIV-1 hijacks the regulated secretory pathway of CD4(+) T cells to enhance its dissemination.


Conflict of interest statement

The authors have declared that no competing interests exist.

Figures

Figure 1
Figure 1. The HIV VS has a regulated secretion phenotype.
A) The MTOC aligns proximal to the VS in the HIV-1 infected T cell. Primary CD4+ T cells infected with the HIV-1 strain BaL were mixed with uninfected autologous target CD4+ T cells that were pre-stained with the non-inhibitory anti-CD4 mAb L120 (green) and cells were incubated on poly-L-lysine-coated coverslips for 1 h at 37°C. Conjugates were fixed, permeabilized and stained for intracellular HIV-1 Env (blue) and γ-tubulin to label the centrosome (red). Two representative 3D reconstructed projections (top panels) and the corresponding DIC images (lower panels) are shown of conjugates formed between an HIV-1 infected T cell and an uninfected target cell (asterisk) showing polarization of the MTOC in the infected cell (indicated by the large arrow). Clusters of HIV-1 Env in the infected cell (indicated by small arrowheads) are located near to the cell-cell interface and around the MTOC. Scale bar = 5 µm. MTOC polarization was quantified (lower left panel) in conjugates that had formed a VS (black bar, defined by enrichment of viral proteins in infected cells at the contact site) or had not formed a VS (white bar, no HIV-1 enrichment) and the MTOC was scored as polarized if it was aligned at the interface-proximal third in the HIV-1 infected cell. Data are from three independent experiments and the error bars represent the SEM. The right hand graph shows the average distance of the MTOC from the plasma membrane at the VS or at the contact site between two uninfected cells (control). Data are from three independent experiments. B) Alignment of secretory organelles and MTOC proximal to the VS in the HIV-1 infected T cell. Infected Jurkat T cells were mixed with primary CD4+ T cells, fixed and embedded. Top panel is a VS overview image. The box indicates the region of the thick section shown in the 3D surface rendering (lower panel) of a tomogram, reconstructed from two sequential tilt series taken from 300 nm sections. Redistribution of secretory organelles (endoplasmic reticulum, ER, not pseudocoloured), secretory lysosomes (SL, orange), Golgi (G, not pseudocoloured), mitochondria (m, green) and lipid bodies (LB, pale blue) and MTOC (blue), towards the site of virus particle (vi, red) release in the HIV-1 infected T cell. C) Quantification of cell polarization. Conjugates between HIV-1 infected cells and target T cells with obvious virus budding (n = 31), or conjugates between two cells without virus (n = 55) were examined by EM and quantified for whether or not cellular organelles were polarized to the site of cell-cell contact. Cells were defined as polarized only when most of the cytoplasm and all the mitochondria, lipid bodies and lysosomes were localized to the contact site. Polarized  =  black, unpolarized  =  white. Target cell  =  uninfected cell, donor  =  HIV-1 infected cell. Single unconjugated cells showing budding virus (n = 96) were also scored for whether organelles were polarized to the site of virus budding, or in the case of single cells without budding virus (n = 216) whether any cellular polarization was evident. Data are from two independent experiments in which two separate grids were examined. See also Fig. 1 and Video S2–S4.
Figure 2
Figure 2. HIV-1 Env associates with SL-related organelles in CD4+ T cells.
A) SL-associated proteins are co-enriched with Env at the VS. HIV-1 infected CD4+ T cells were mixed with uninfected autologous target T cells and incubated on coverslips at 37°C for up to 2 h. Conjugates were fixed, permeabilized and stained for Env (red) and FasL or CTLA-4 (green). Images are single xy sections taken through the middle of a conjugate with the corresponding DIC image. The target cell is indicated with an asterisk. Areas of colocalization are yellow. Scale bar = 5 µm. B) HIV-1 Env colocalizes intracellularly with SL-associated proteins. Single CD4+ T cells infected with HIV-1 were fixed, permeabilized and stained for intracellular Env (red) and CD63, cathepsin D, CTLA-4 or FasL (green). Primary antibodies were detected with species or isotype-specific conjugated secondary antibodies. Images are 3D reconstructions of serial z-sections taken by LSCM with the corresponding merged and DIC images shown. C) Quantification of colocalization between Env and CD63 (n = 21), cathepsin D (n = 25), CTLA-4 (n = 20) and FasL (n = 20) are shown. As a control, colocalization between Env and the mitochondrial protein ATP synthase subunit β was also quantified. For each infected cell, quantification of colocalization was performed on a single xy slice extracted from the corresponding z series and the Pearson’s correlation coefficient (r) was calculated. The average r values are graphed and error bars show the SEM from four experiments performed using six individual donors. D) HIV-1 Gag does not colocalize with cathepsin D. HIV-1 infected CD4+ T cells were fixed, permeabilized and stained for HIV-1 Gag (red) and cathepsin D (green). The corresponding DIC image is shown.
Figure 3
Figure 3. HIV-1 Env colocalizes with enlarged SL-related organelles in CHS cells.
A) CD4+ T cells from CHS individuals contain enlarged lysosomes. CD4+ T cells were activated for 24 h with anti-CD3 mAb at 7–14 days post-stimulation, fixed, permeabilized and stained by immunofluorescence for CD63, CTLA-4 and FasL. Images are 3D reconstructed z-series, areas of colocalization appear yellow and the corresponding DIC images are shown. Enlarged CD63+ SLs are present without CD3 activation, but CTLA-4 and FasL expression are increased following activation (data not shown). B) HIV-1 Env colocalizes with SL in CHS CD4+ T cells. CD4+ T cell clones were infected with HIV-1 and 10–12 days post-infection the cells were fixed, permeabilized and stained by IF for Env (red) and CD63, FasL or cathepsin D (green). Images are 3D reconstructed z-series and areas of colocalization are yellow. C) Quantification of colocalization (the average r value) is shown for Env and CD63 (n = 21), cathepsin D (n = 25) and FasL (n = 21) and was performed as described in Fig. 2. Data are from four independent experiments performed with three cell lines from two unrelated CHS patients. D) Cryo-immuno EM of Env and cathepsin D staining in HIV-1-infected CHS cells. CHS cells were infected with HIV-1, fixed, frozen and cryosectioned and stained with anti-cathepsin D (detected with 10 nm gold) and the HIV-1 Env mAb2G12 (detected with 5 nm gold). Left panel shows the presence of multiple, enlarged cathepsin D-positive compartments in the CHS cell. This is shown in more detail in the middle panel with Env (5 nm gold) staining highlighted with arrowheads. Two boxed regions are magnified in the right panel to more clearly show cathespin D (10 nm gold) and Env (5 nm gold and arrowheads) colocalization. Scale bar = 600 nm.
Figure 4
Figure 4. HIV-1 Env colocalizes with SL-associated proteins following endocytosis from the plasma membrane.
A) HIV-1 infected WT and CHS CD4+ T cells express HIV-1 Env at the plasma membrane, evidence of functional constitutive trafficking. WT and CHS cells infected with HIV-1 were stained with the mAb 2G12 and anti-human conjugated-PE on ice at 7 days post-infection to label surface expressed gp120 and analyzed by flow cytometry. HIV-1 gp120 surface staining on infected cells (black line) is overlaid onto uninfected cells also stained with 2G12 (grey filled). Histograms are representative of independent experiments performed with two WT and two CHS cell lines. B) Confocal analysis of endocytosed Env colocalizing with SL-associated proteins. WT CD4+ T cells (top two panels) and CHS cells (lower two panels) were infected with HIV-1, incubated for 4–5 days, washed and incubated for 24 hours in media containing 10 µg/ml of the HIV-1 gp120 specific mAb IgGb12. The cells were then fixed, permeabilized and stained with anti-CD63 or anti-CTLA-4 (green). Endocytosed, intracellular Env was detected with anti-human secondary antibody (red) and CD63 and CTLA-4 with anti-mouse secondary antibody. Images are 3D reconstructed z-series representative of experiments performed with cells from two CHS patients and two WT donors. Areas of colocalization are yellow and the corresponding DIC images are shown. C) Quantification of colocalization between endocytosed Env and SL-associated proteins (average r value) is shown for Env and CD63 in WT cells (n = 9) and CHS cells (n = 18) and was performed as described in Fig. 2. Error bars show the SEM.
Figure 5
Figure 5. CHS CD4+ T cells are less able to support HIV-1 replication in culture.
A) CHS CD4+ T cells (black bars) and cells from normal WT donors (white bars) were infected with HIV-1 and supernatants were taken at various days post-infection and virus release was quantified by HIV-1 Gag p24 ELISA. Values in the upper panel were normalized to viable cell count and are ng p24/ml/106 cells and show Gag p24 from supernatants taken at 10–12 days post-infection. The lower panel shows the Gag p24 levels from the same experiments at all time points. Data are from four independent experiments performed using four different WT donors and three different CHS cell lines from two unrelated patients. Error bars show the SEM. B) CHS cells produce infectious virus. Cell-free supernatants were harvested at 10–12 days post-infection and viral infectivity was quantified on HeLa Tzm-bl reporter cells by luciferase assay. The TCID50 was calculated and data are shown as the TCID50 per ng of p24 to normalize for differences in the amount of virus in the supernatant. Data are from three independent experiments performed using four different WT donors and three different CHS cell lines from two unrelated patients. Error bars show the SEM. C) Western blotting analysis of HIV-1 Env incorporation into purified virions. Viral particles from HIV-1 infected cultures were purified by ultracentrifugation and concentrated 10-fold. An equal volume was loaded onto polyacrylamide gels and viral proteins were separated by SDS-PAGE. Western blotting was performed with rabbit anti-Env and rabbit anti-Gag serum and proteins were visualized by ECL. Western blots of two WT donors and two CHS patients are shown and are representative of results obtained using four WT virus samples and four CHS virus samples. One example of PHA blasts (left panels) and one example of cloned CD4+ T cells (right panels) are shown. Note that HIV-1 Env gp120 and unprocessed gp160 can be detected in all virus samples. D) Quantification of HIV-1 infected cells. CHS cells and WT cells were fixed, stained for HIV-1 Gag and the number of Gag+ infected cells was quantified by LSCM. Data are from three independent experiments with the SEM. E) Confocal microscopy of a VS formed between an infected CHS T cell and a target T cell. HIV-1 infected CHS CD4+ T cells were mixed with an equal number of uninfected CHS CD4+ T cells (prestained with the CD4 mAb L120 (green)) and conjugates were incubated for 1 h at 37°C (upper panel). Cells were then fixed, permeabilized and stained for HIV-1 Env with 2G12 (red) and HIV-1 Gag (blue) and examined by LSCM. The target cell is indicated with an asterisk on the corresponding DIC image. A representative VS formed between two WT cells is shown for comparison (lower panel).
Figure 6
Figure 6. CHS cells support HIV-1 infection and Gag budding over a single- round of replication but transmit virus less efficiently by cell-to-cell spread.
A) CHS CD4+ T cells are susceptible to infection with pseudotyped virus. 106 CD4+ T cell blasts from three WT donors and one CHS patient were infected in duplicate with replication-defective VSV-G pseudotyped HIV-1 encoding the luciferase gene. Infection was quantified after 24 h by luminescence assay and the relative light units are shown with the SEM. Data are from two independent experiments performed with three unrelated WT donors and one CHS donor. B) CHS and WT cells release equivalent amounts of Gag p24 over a single infection cycle. 106 WT and CHS CD4+ T cells were infected in triplicate with replication-defective VSV-G pseudotyped HIV-1 and cell and viral lysates were separated by SDS-PAGE and probed with rabbit anti-Gag by Western blotting. The relative amount of cell-free-to-cell-associated Gag was quantified using Image J. Equal loading of cell lysates was verified by probing membranes with anti-actin antibody. A representative blot is shown with quantification from three independent experiments performed with four WT donors and one CHS patient. Error bars show the SEM. C) CHS cells transmit virus less efficiently to target T cells by cell-to-cell spread. CD4+ T cell blasts from three WT donors and one CHS patient were infected with HIV-1 strain NL4.3 for 48 h and an equal number of donor cells were mixed with 1G5 target T cells for 24 h.1G5 cells express an HIV-1 Tat-inducible firefly luciferase reporter gene and cell-to-cell spread of HIV-1 from donor T cells to target T cells was measured by luminescence assay. Data from one of two independent experiments is shown and error bars show the SD.
Figure 7
Figure 7. Defects in regulated secretion inhibit cell-to-cell spread of HIV-1.
A) Lyst modulates cell-to-cell spread of HIV-1 measured by quantitative real-time PCR. HIV-1 infected Jurkat T cells stably expressing Lyst-shRNA (black bars) or control-shRNA (white bars) were mixed with an equal number of uninfected target T cells and incubated for 0, 1, 3 and 6 hours prior to lysis and extraction of DNA. Quantitative real-time PCR using pol primers was performed to quantify de novo HIV-1 DNA synthesis as a measure of HIV-1 cell-to-cell spread. The HIV-1 DNA copy number was normalized to human serum albumin (HSA) and is shown as the ratio of HIV-1 DNA to HSA DNA. The data obtained at t = 0 h (baseline) were subtracted from the test values. Data are from three independent experiments and error bars show the SEM. B) Quantification of cell-cell spread using a luciferase reporter T cell line. HIV-1 infected Jurkat T cells expressing control-shRNA, Lyst-shRNA or Syntaxin 4-shRNA were mixed with an equal number of uninfected 1G5 target T cells that were either untreated (white bars) pre-treated with 50 µM Zidovudine (grey bars) and incubated for 24 h. 1G5 cells express an HIV-1 Tat-inducible firefly luciferase reporter gene and virus infection was measured by luminescence. Data show the relative light units from a representative of two independent experiments and error bars show the SD. C) Lyst knockdown cells produce infectious cell-free virus. Cell-free supernatants were harvested from cells infected with replication competent HIV-1 at 7 days post-infection and viral infectivity was quantified on HeLa Tzm-bl reporter cells by luciferase assay. The TCID50 was calculated and data are shown as the TCID50 per ng of p24 to normalize for any differences in the viral content of supernatants. Data are from three independent experiments and show the SEM. D) Lyst and control knockdown cells produce equivalent amounts of p24 over a single infection cycle. Lyst-shRNA cells and control-shRNA cells were infected with replication-defective VSV-G pseudotyped HIV-1 for 48 h. Cell and viral lysates were separated by SDS-PAGE and probed for Gag p24 by Western blotting. The relative amount of cell-free-to-cell-associated Gag was quantified using Image J. Equal loading of cell lysates was verified by probing membranes with anti-actin antibody. A representative blot is shown with quantification from two independent experiments with the SEM is shown.
Figure 8
Figure 8. Syntaxin 4 contributes to cell-to-cell spread of HIV-1.
A) HIV-1 infected Jurkat T cells expressing syntaxin 4-shRNA (black bars) or control-shRNA (white bars) were used to measure cell-to-cell spread of virus by quantitative real-time PCR as described in Fig. 7. Data are from three independent experiments and error bars show the SEM. B) Syntaxin 4 knockdown cells produce infectious cell-free virus. Cell-free supernatants were harvested from cells infected with replication competent HIV-1 at 7 days post-infection and viral infectivity was quantified on HeLa Tzm-bl reporter cells by luciferase assay. The TCID50 was calculated and data are shown as the TCID50 per ng of p24 to normalize for any differences in the viral content of supernatants. Data are from three independent experiments and show the SEM. C) Syntaxin-4 and control knockdown cells produce equivalent amounts of p24 over a single infection cycle. Syntaxin-4-shRNA cells and control-shRNA cells were infected with replication-defective VSV-G pseudotyped HIV-1 for 48 h. Cell and viral lysates were separated by SDS-PAGE and probed for Gag p24 by Western blotting. The relative amount of cell-free-to-cell-associated Gag was quantified using Image J. Equal loading of cell lysates was verified by probing membranes with anti-actin antibody. A representative blot is shown with quantification from two independent experiments with the SEM is shown.

Similar articles

Cited by

References

    1. Sattentau Q. Avoiding the void: cell-to-cell spread of human viruses. Nat Rev Microbiol. 2008;6:815–826. - PubMed
    1. Jolly C, Kashefi K, Hollinshead M, Sattentau QJ. HIV-1 cell to cell transfer across an Env-induced, actin-dependent synapse. J Exp Med. 2004;199:283–293. - PMC - PubMed
    1. Sowinski S, Jolly C, Berninghausen O, Purbhoo MA, Chauveau A, et al. Membrane nanotubes physically connect T cells over long distances presenting a novel route for HIV-1 transmission. Nat Cell Biol. 2008;10:211–219. - PubMed
    1. Rudnicka D, Feldmann J, Porrot F, Wietgrefe S, Guadagnini S, et al. Simultaneous cell-to-cell transmission of human immunodeficiency virus to multiple targets through polysynapses. J Virol. 2009;83:6234–6246. - PMC - PubMed
    1. Jolly C, Sattentau QJ. Retroviral spread by induction of virological synapses. Traffic. 2004;5:643–650. - PubMed

Publication types

MeSH terms