. 2011 Sep;7(9):e1002231.
doi: 10.1371/journal.ppat.1002231. Epub 2011 Sep 1.

HTLV-1 propels thymic human T cell development in "human immune system" Rag2⁻/⁻ gamma c⁻/⁻ mice

Affiliations

HTLV-1 propels thymic human T cell development in "human immune system" Rag2⁻/⁻ gamma c⁻/⁻ mice

Julien Villaudy et al. PLoS Pathog. 2011 Sep.

Abstract

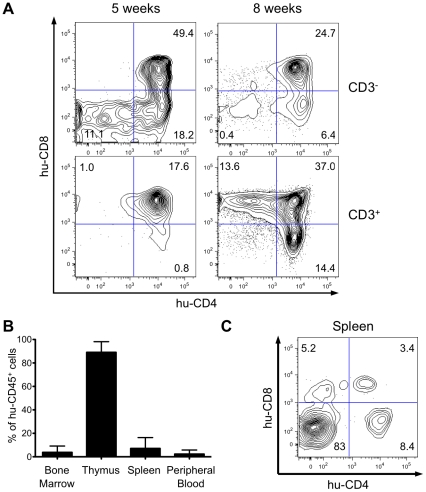
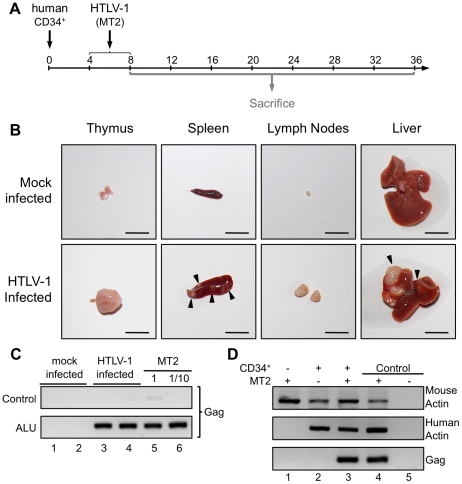
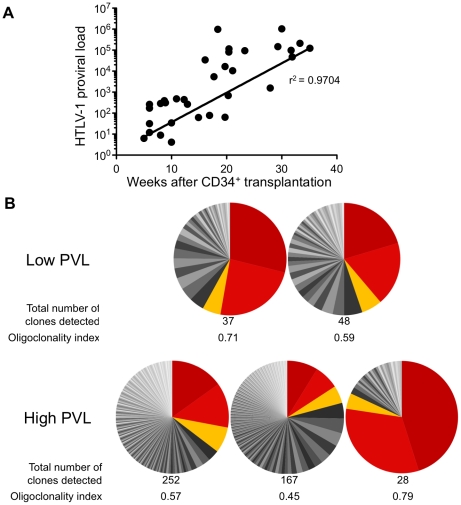
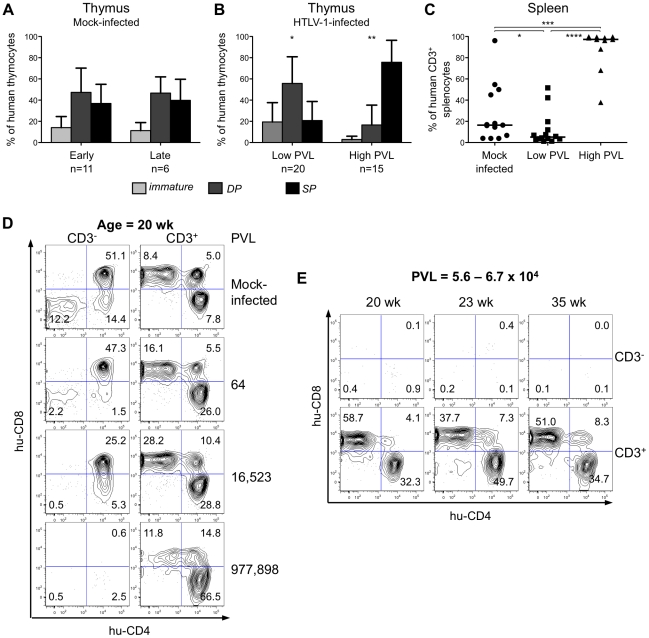
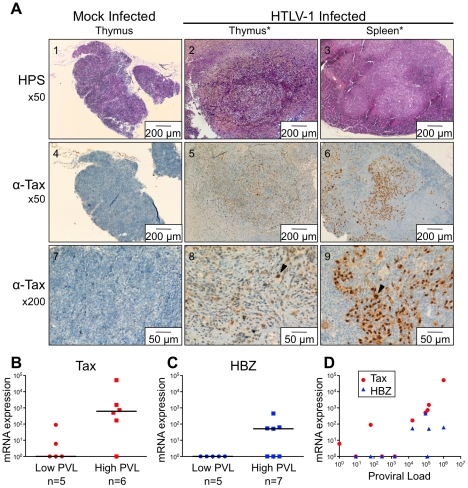
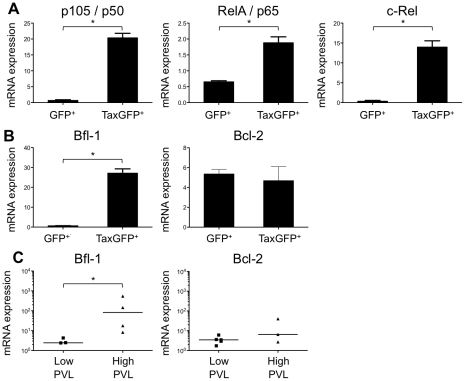
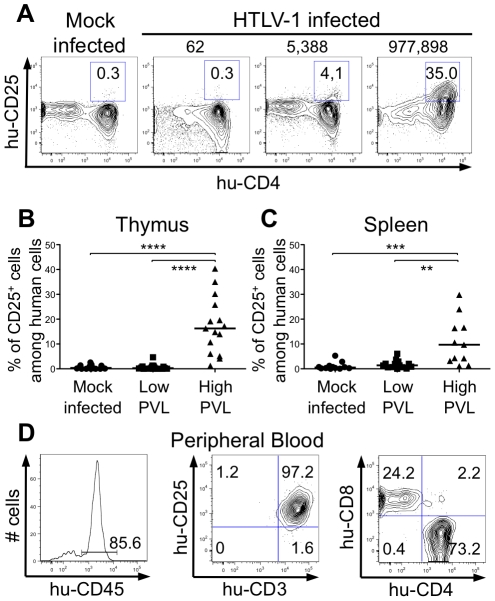
Alteration of early haematopoietic development is thought to be responsible for the onset of immature leukemias and lymphomas. We have previously demonstrated that Tax(HTLV-1) interferes with ß-selection, an important checkpoint of early thymopoiesis, indicating that human T-cell leukemia virus type 1 (HTLV-1) infection has the potential to perturb thymic human αβ T-cell development. To verify that inference and to clarify the impact of HTLV-1 infection on human T-cell development, we investigated the in vivo effects of HTLV-1 infection in a "Human Immune System" (HIS) Rag2⁻/⁻γ(c)⁻/⁻ mouse model. These mice were infected with HTLV-1, at a time when the three main subpopulations of human thymocytes have been detected. In all but two inoculated mice, the HTLV-1 provirus was found integrated in thymocytes; the proviral load increased with the length of the infection period. In the HTLV-1-infected mice we observed alterations in human T-cell development, the extent of which correlated with the proviral load. Thus, in the thymus of HTLV-1-infected HIS Rag2⁻/⁻γc⁻/⁻ mice, mature single-positive (SP) CD4⁺ and CD8⁺ cells were most numerous, at the expense of immature and double-positive (DP) thymocytes. These SP cells also accumulated in the spleen. Human lymphocytes from thymus and spleen were activated, as shown by the expression of CD25: this activation was correlated with the presence of tax mRNA and with increased expression of NF-kB dependent genes such as bfl-1, an anti-apoptotic gene, in thymocytes. Finally, hepato-splenomegaly, lymphadenopathy and lymphoma/thymoma, in which Tax was detected, were observed in HTLV-1-infected mice, several months after HTLV-1 infection. These results demonstrate the potential of the HIS Rag2⁻/⁻γ(c)⁻/⁻ animal model to elucidate the initial steps of the leukemogenic process induced by HTLV-1.


Conflict of interest statement

The authors have declared that no competing interests exist.

Figures

Figure 1
Figure 1. Human hematopoietic cell engraftment and T-cell development in HIS Rag2-/-γc -/- mice.
(A) Efficient intrathymic de novo development of human T-cells in BALB/c Rag2-/-γc -/- mice. Animals were sacrificed at 5 and 8 weeks after CD34+ cell transplantation. The flow cytometry dot plots show representative examples of staining for human CD3, CD4 and CD8 markers (values on the dot plots are for the frequency of the corresponding populations). (B) Frequency of human CD45+ cells in bone marrow, spleen, thymus and peripheral blood in HIS Rag2-/-γc -/- mice, at 10 to 30 weeks post transplantation. (C) Representative flow cytometry analysis of total splenocytes in transplanted mice sacrificed at 7 weeks after transplantation stained for human CD4 and CD8 lymphoid cell surface markers.
Figure 2
Figure 2. Integration of the HTLV-1 provirus in the genome of human cells in HTLV-1-infected HIS Rag2-/-γc -/- mice.
(A) Schematic representation of the experimental infection set-up. Four to eight weeks after CD34+ cell transplantation, the animals were intraperitoneally inoculated with 2×10⁶ lethally irradiated MT2 cells in 100 µl PBS or with PBS alone for the mock-infected mice. Animals were sacrificed and analyzed between 8 and 36 weeks after CD34+ cell transplantation. (B) Presence of disseminated tumors in HTLV-1 infected HIS Rag2-/-γc -/- mice, sacrificed between 16 and 35 weeks after infection and referred to as high proviral load (PVL) mice. Infection resulted in thymoma, and splenomegaly and HTLV-1 positive lymphomas in spleen, in mesenteric lymph nodes or in liver (arrows). Are also shown representative photographs of thymus, spleen, lymph node and liver of 34-week-old HIS Rag2-/-γc -/- control mice. Bars, 10 mm (C) ALU-PCR was carried out on the DNA extracted from the thymus of mock-infected (lanes 1 and 2) and infected (lanes 3 and 4) mice. The lower panel (two-rounds of PCR, the first one with ALU primers and the second with gag primers) indicates that the HTLV-1 gag gene is integrated in the human genome. The upper panel shows the result of control PCR for gag carried out on the initial diluted samples without any ALU-PCR. (D) HTLV-1 integration does not occur in the mouse genome: PCR for mouse and human actin and for gag were performed with the DNA extracted from the spleen of Rag2-/-γc -/- mice (not inoculated with human CD34+ cells), infected with HTLV-1 (lane 1), or HIS Rag2-/-γc -/- mice either mock-infected (lane 2) or infected with HTLV-1 (lane 3).
Figure 3
Figure 3. Proviral load and clonality in HTLV-1-infected HIS Rag2-/-γc -/- mice.
(A) Temporal evolution of proviral load (PVL) in the thymus. The HTLV-1 PVL (representing the copy number of tax per 105 human cells) were determined by quantitative real-time PCR at the indicated times after CD34+ cell transplantation. The PVL level correlates with the length of the infection period (r2 = 0.9704). Samples were analyzed at least in duplicate; on all graphs, one dot represents one individual HIS Rag2-/-γc -/- mouse. (B) Clone frequency distribution of HTLV-1 infected cells in the spleen from 5 different mice. The HTLV-1 clonal structure in each genomic DNA sample is depicted by a pie chart. Each slice represents one unique insertion site (clone); the size of the slice is proportional to the relative abundance of that clone. The 3 most abundant clones were colored in red/orange in each spleen sample. The total number of detected clones was given together with the oligoclonality index values calculated as described in .
Figure 4
Figure 4. The human T-cell development is altered in HTLV-1-infected HIS Rag2-/-γc -/- mice.
(A) Composite data from 11 mock-infected mice sacrificed early after CD34+ cell transplantation (early) and 6 mock-infected mice sacrificed later on (late). Bar graphs represent percent of human CD45+ thymocytes that are CD4-CD8- and CD4ISP immature cells (light grey), DP cells (dark grey) and SP cells (black). The graphs present the mean and the SD. Statistical differences were calculated using the χ2 test: *P<0.05, **P<0.01. (B) Composite data from 20 HTLV-1-infected mice with a low PVL and 15 HTLV-1-infected mice with a high PVL showing a decrease in the frequency of the immature thymocytes (light grey) concomitant with an increase of that of the mature SP cells (black) in high PVL mice. (C) Expansion of human CD3+ T-cells at the periphery after HTLV-1 infection: FACS analysis of CD3 expression by hCD45+ splenocytes in 35 HIS Rag2-/-γc -/- either mock- or HTLV-1-infected mice. The median values are indicated by horizontal lines. Statistical differences were calculated using the Mann-Whitney's U test: *P<0.05, ***P<0.001, ****P<0.0001. (D) Correlation between HTLV-1 proviral load, the depletion of immature thymocytes and the expansion of mature thymocytes. FACS plots of the immature CD3- subpopulations containing DN (CD4-CD8-), immature DP and CD4ISP and the mature CD3+ subpopulations, stained for human CD4 and CD8 are shown for representative animals either mock-infected or HTLV-1-infected with different PVL (indicated on the right side) and killed at 20 weeks after CD34+ cell transplantation. (E) The alteration of the human thymopoiesis induced by HTLV-1 is independent on the duration of the infection period: FACS analysis of the human CD3- and CD3+ thymocyte subpopulations in three HTLV-1-infected mice sacrificed at different weeks after CD34+ cell transplantation, but each with a similar high PVL (from 5.6×10⁴ to 6.7×10⁴ copies/105 cells).
Figure 5
Figure 5. Expression of Tax and HBZ in thymocytes isolated from HTLV-1-infected HIS Rag2-/-γc -/- mice.
(A) Immunohistological characterization of representative sections of thymus and spleen from HTLV-1- and mock-infected HIS mice. The thymus of control mice (1) shows a normal architecture, whereas that of HTLV-1-infected mice contains a dense cellular infiltrate made of large lymphoid cells interspersed with giant multinucleated cells (2). A disorganized architecture is also observed in the infected spleen; the white pulp is hyperplastic and is made of large lymphoid aggregates containing large lymphoid cells and multinucleate cells; the red pulp shows extramedullary hematopoiesis with myeloid and erythroid elements (3). Tax immunostaining reveals that the thymus and spleen of infected animals displayed large lymphoma cells with a nuclear localization of Tax (5,6,8,9). Infiltration of lymphomatous cells expressing Tax was not observed in control mice (4,7). (B-C) Tax and HBZ mRNA loads in thymocytes isolated from HTLV-1-infected HIS Rag2-/-γc -/- mice. Total RNAs were extracted from thymocytes of infected mice with either a low or a high PVL, and levels of mRNA coding for Tax and HBZ were measured by RT-qPCR and normalized to b-actin. The zero value of Tax and HBZ gene transcripts was observed in 60 and 100% of mice with low PVL, respectively; the median values are indicated by horizontal lines. (D) Dot plot graph of Tax and HBZ mRNA loads as a function of the proviral load.
Figure 6
Figure 6. Enhanced transcription of the NF-κB and the antiapoptotic Bfl1 genes by Tax.
(A-B) Immature thymocytes isolated as previously described were nucleofected with either pCMV-TaxGFP or pCMV-GFP. Twenty-four hours later, GFP+ cells were sorted, and the total RNAs were isolated and reverse transcribed. The cDNA samples were subjected to qPCR using primers specific for the indicated genes and normalized for the amount of cDNA, using human β-actin as an internal control. Standard deviations are from at least two determinations performed in triplicate. * P<0.05 by Mann-Whitney U test. (C) In vivo correlation between the Bfl1 gene transcription and the HTLV-1 proviral load: total RNAs were extracted from thymocytes of HTLV-1-infected HIS Rag2-/-γc -/- mice from each group, and levels of bfl-1 and bcl-2 mRNAs normalized to human b-actin were measured by RT-qPCR. Levels of bfl-1 mRNAs were significantly higher in high PVL mice than in low PVL mice, whereas bcl-2 transcription was unchanged. The median values are indicated by horizontal lines. * P<0.05 using the Mann-Whitney U test.
Figure 7
Figure 7. Correlation between expression of CD25 activation marker and HTLV-1 proviral load.
(A) Representative flow cytometry plots showing the expression of human CD25 and CD4 markers on thymocytes of 17 mock- and 35 HTLV-1-infected HIS Rag2-/-γc -/- mice with different PVL (indicated on top). (B) Frequency of human CD4+ cells expressing CD25 among human thymocytes of 35 HIS Rag2-/-γc -/- HTLV-1-infected mice; the median values are indicated by horizontal lines. (C) Frequency of human CD4+ cells expressing CD25 among human splenocytes of 35 HIS Rag2-/-γc -/- mice; the median values are indicated by horizontal lines. Statistical differences were calculated using the Mann-Whitney U test: **P<0.01, ***P<0.001, ****P<0.0001. (D) Lymphoproliferation in the peripheral blood of one HTLV-1-infected HIS Rag2-/-γc -/- mouse with a high PVL (7.3×10⁴ copies/105 cells): this flow cytometry analysis shows that among the 85.6% of huCD45+ cells (left panel), 97.2% are activated T lymphocytes (center panel), the majority with a CD4+ phenotype (right panel).

Similar articles

Cited by

References

    1. Yoshida M, Miyoshi I, Hinuma Y. Isolation and characterization of retrovirus from cell lines of human adult T-cell leukemia and its implication in the disease. Proc Natl Acad Sci U S A. 1982;79:2031–2035. - PMC - PubMed
    1. Poiesz BJ, Ruscetti FW, Gazdar AF, Bunn PA, Minna JD, et al. Detection and isolation of type C retrovirus particles from fresh and cultured lymphocytes of a patient with cutaneous T-cell lymphoma. Proc Natl Acad Sci U S A. 1980;77:7415–7419. - PMC - PubMed
    1. Matsuoka M, Jeang KT. Human T-cell leukaemia virus type 1 (HTLV-1) infectivity and cellular transformation. Nat Rev Cancer. 2007;7:270–280. - PubMed
    1. Nakano S, Ando Y, Saito K, Moriyama I, Ichijo M, et al. Primary infection of Japanese infants with adult T-cell leukaemia-associated retrovirus (ATLV): evidence for viral transmission from mothers to children. J Infect. 1986;12:205–212. - PubMed
    1. Aifantis I, Raetz E, Buonamici S. Molecular pathogenesis of T-cell leukaemia and lymphoma. Nat Rev Immunol. 2008;8:380–390. - PubMed

Publication types