

The three-dimensional distribution of αA-crystalline in rat lenses and its possible relation to transparency
- PMID: 21909355
- PMCID: PMC3166126
- DOI: 10.1371/journal.pone.0023753
The three-dimensional distribution of αA-crystalline in rat lenses and its possible relation to transparency
Abstract
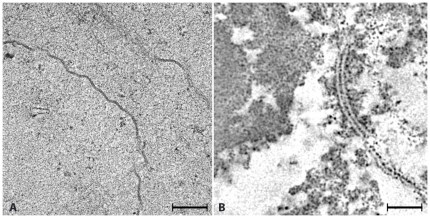
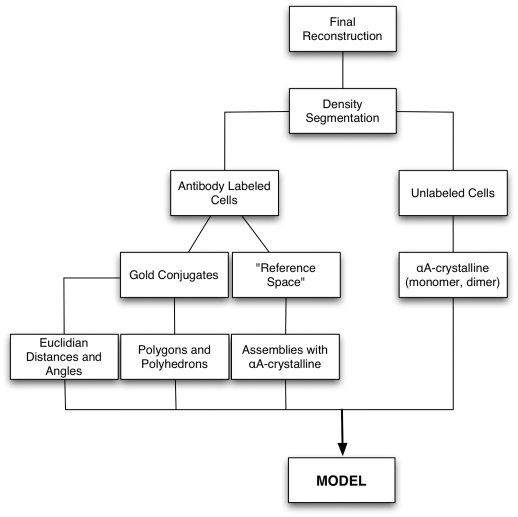
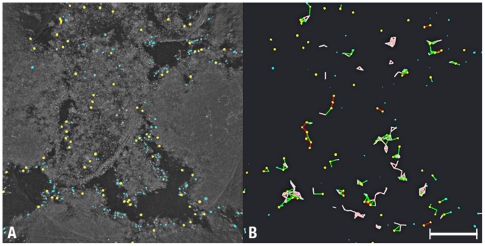
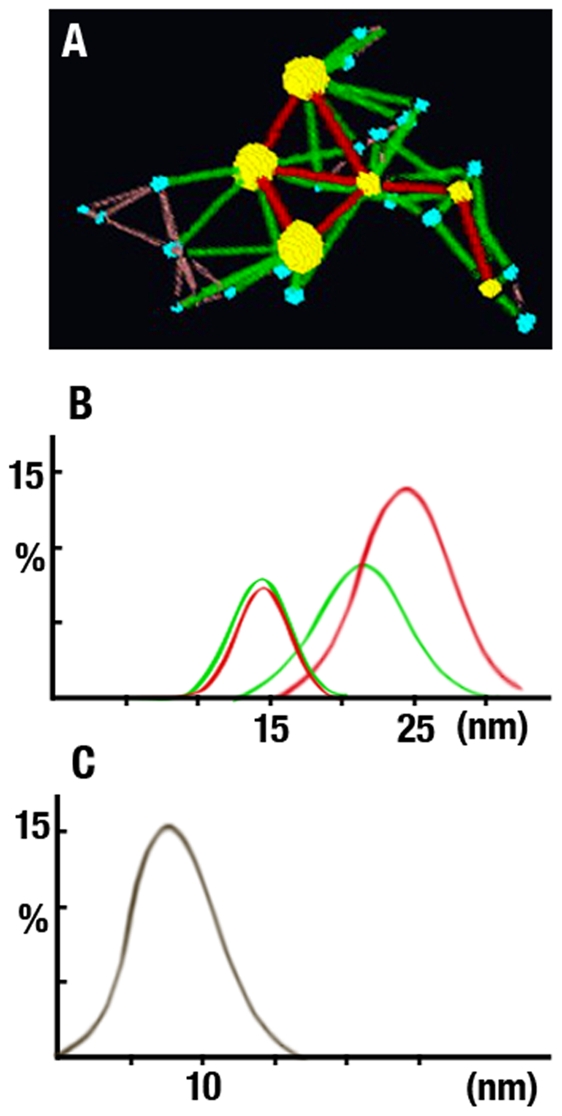
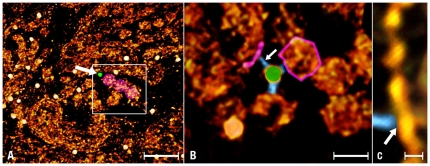
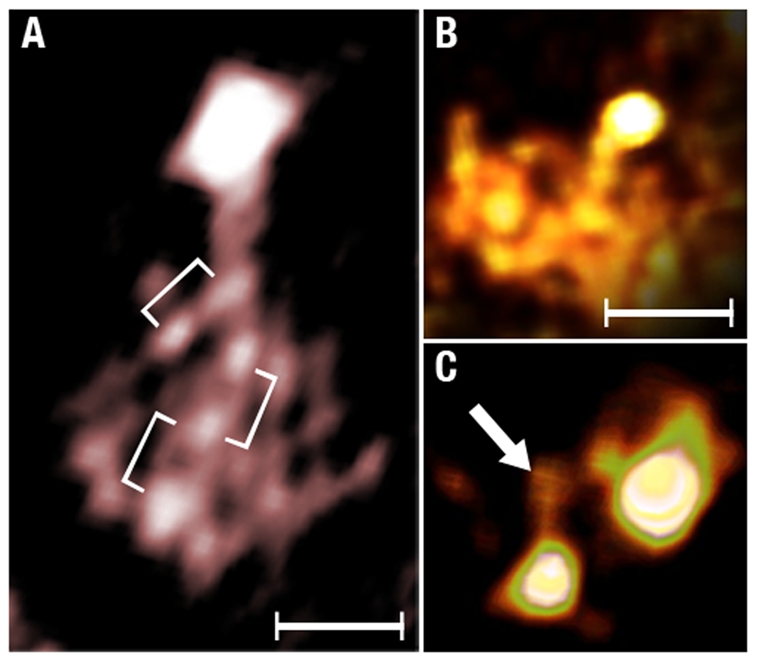
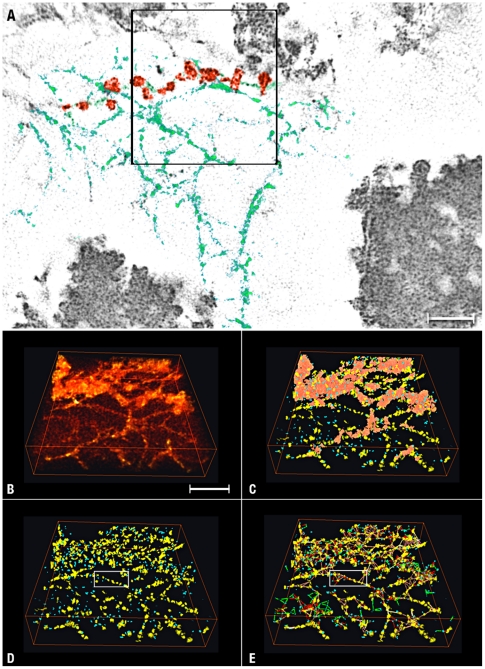
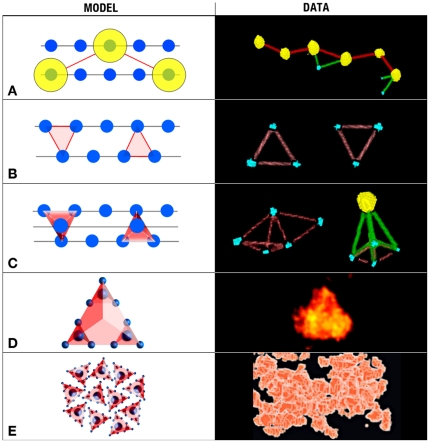
Lens transparency depends on the accumulation of massive quantities (600-800 mg/ml) of twelve primary crystallines and two truncated crystallines in highly elongated "fiber" cells. Despite numerous studies, major unanswered questions are how this heterogeneous group of proteins becomes organized to bestow the lens with its unique optical properties and how it changes during cataract formation. Using novel methods based on conical tomography and labeling with antibody/gold conjugates, we have profiled the 3D-distribution of the αA-crystalline in rat lenses at ∼2 nm resolutions and three-dimensions. Analysis of tomograms calculated from lenses labeled with anti-αA-crystalline and gold particles (∼3 nm and ∼7 nm diameter) revealed geometric patterns shaped as lines, isosceles triangles and polyhedrons. A Gaussian distribution centered at ∼7.5 nm fitted the distances between the ∼3 nm diameter gold conjugates. A Gaussian distribution centered at ∼14 nm fitted the Euclidian distances between the smaller and the larger gold particles and another Gaussian at 21-24 nm the distances between the larger particles. Independent of their diameters, tethers of 14-17 nm in length connected files of gold particles to thin filaments or clusters to ∼15 nm diameter "beads." We used the information gathered from tomograms of labeled lenses to determine the distribution of the αA-crystalline in unlabeled lenses. We found that αA-crystalline monomers spaced ∼7 nm or αA-crystalline dimers spaced ∼15 nm center-to-center apart decorated thin filaments of the lens cytoskeleton. It thus seems likely that lost or gain of long-range order determines the 3D-structure of the fiber cell and possible also cataract formation.
Conflict of interest statement
Figures
Similar articles
-
Tissue localization and solubilities of αA-crystallin and its numerous C-terminal truncation products in pre- and postcataractous ICR/f rat lenses.Invest Ophthalmol Vis Sci. 2010 Oct;51(10):5153-61. doi: 10.1167/iovs.10-5302. Epub 2010 Apr 30. Invest Ophthalmol Vis Sci. 2010. PMID: 20435586 Free PMC article.
-
αA-Crystallin associates with α6 integrin receptor complexes and regulates cellular signaling.Exp Eye Res. 2010 Nov;91(5):640-51. doi: 10.1016/j.exer.2010.08.006. Epub 2010 Aug 13. Exp Eye Res. 2010. PMID: 20709056 Free PMC article.
-
αA-crystallin peptide SDRDKFVIFLDVKHF accumulating in aging lens impairs the function of α-crystallin and induces lens protein aggregation.PLoS One. 2011 Apr 28;6(4):e19291. doi: 10.1371/journal.pone.0019291. PLoS One. 2011. PMID: 21552534 Free PMC article.
-
Negative charge at aspartate 151 is important for human lens αA-crystallin stability and chaperone function.Exp Eye Res. 2019 May;182:10-18. doi: 10.1016/j.exer.2019.02.023. Epub 2019 Mar 5. Exp Eye Res. 2019. PMID: 30849387
-
Arginine 54 and Tyrosine 118 residues of {alpha}A-crystallin are crucial for lens formation and transparency.Invest Ophthalmol Vis Sci. 2006 Jul;47(7):3004-10. doi: 10.1167/iovs.06-0178. Invest Ophthalmol Vis Sci. 2006. PMID: 16799046
Cited by
-
Electron tomography of fiber cell cytoplasm and dense cores of multilamellar bodies from human age-related nuclear cataracts.Exp Eye Res. 2012 Aug;101:72-81. doi: 10.1016/j.exer.2012.06.005. Epub 2012 Jun 20. Exp Eye Res. 2012. PMID: 22728317 Free PMC article.
-
An increase in phosphorylation and truncation of crystallin with the progression of cataracts.Curr Ther Res Clin Exp. 2013 Jun;74:9-15. doi: 10.1016/j.curtheres.2012.10.003. Curr Ther Res Clin Exp. 2013. PMID: 24384929 Free PMC article.
-
Nonproliferative and Proliferative Lesions of the Ratand Mouse Special Sense Organs(Ocular [eye and glands], Olfactory and Otic).J Toxicol Pathol. 2018;31(3 Suppl):97S-214S. doi: 10.1293/tox.31.97S. Epub 2018 Jul 28. J Toxicol Pathol. 2018. PMID: 30158741 Free PMC article. Review. No abstract available.
-
Localization of αA-Crystallin in Rat Retinal Müller Glial Cells and Photoreceptors.Microsc Microanal. 2018 Oct;24(5):545-552. doi: 10.1017/S1431927618015118. Epub 2018 Sep 26. Microsc Microanal. 2018. PMID: 30253817 Free PMC article.
References
-
- Kuwabara T, Imaizumi M. Denucleation process of the lens. Investigative ophthalmology. 1974;13:973–81. - PubMed
-
- Kuwabara T. The maturation of the lens cell: a morphologic study. Exp Eye Res. 1975;20:427–43. - PubMed
-
- Bassnett S, Beebe DC. Coincident loss of mitochondria and nuclei during lens fiber cell differentiation. Dev Dyn. 1992;194:85–93. doi: 10.1002/aja.1001940202. - DOI - PubMed
-
- Kuszak JR, Zoltoski RK, Sivertson C. Fibre cell organization in crystalline lenses. Exp Eye Res. 2004;78:673–87. - PubMed
-
- Cvekl A, Piatigorsky J. Lens development and crystallin gene expression: many roles for Pax-6. Bioessays. 1996;18:621–30. doi: 10.1002/bies.950180805. - DOI - PubMed
