

Metformin treatment has no beneficial effect in a dose-response survival study in the SOD1(G93A) mouse model of ALS and is harmful in female mice
- PMID: 21909419
- PMCID: PMC3164704
- DOI: 10.1371/journal.pone.0024189
Metformin treatment has no beneficial effect in a dose-response survival study in the SOD1(G93A) mouse model of ALS and is harmful in female mice
Abstract
Background: Amyotrophic Lateral Sclerosis (ALS) is a devastating neurological disorder characterized by selective degeneration of upper and lower motor neurons. The primary triggers for motor neuron degeneration are unknown but inflammation, oxidative stress and mitochondrial defects have been identified as potential contributing factors. Metformin is an anti-type II diabetes drug that has anti-inflammatory and anti-oxidant properties, can bring about mitochondrial biogenesis and has been shown to attenuate pathology in mouse models of Huntington's disease and multiple sclerosis. We therefore hypothesized that it might increase survival in the SOD1(G93A) murine model of ALS.
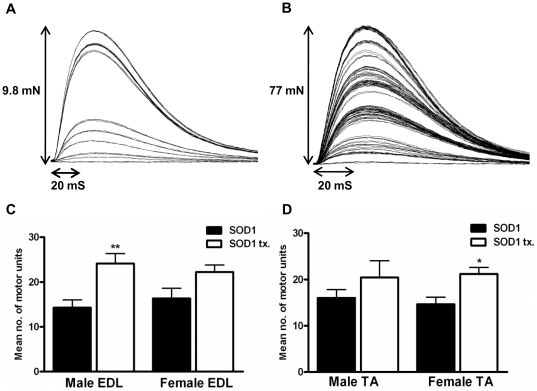
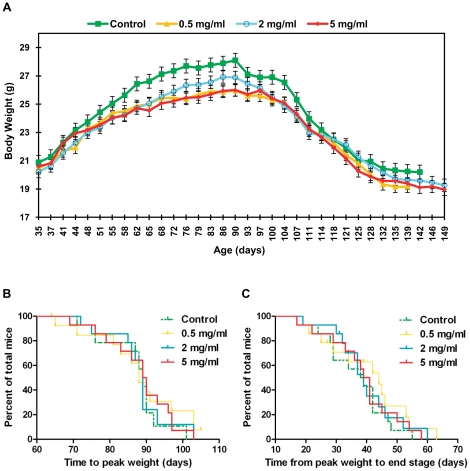
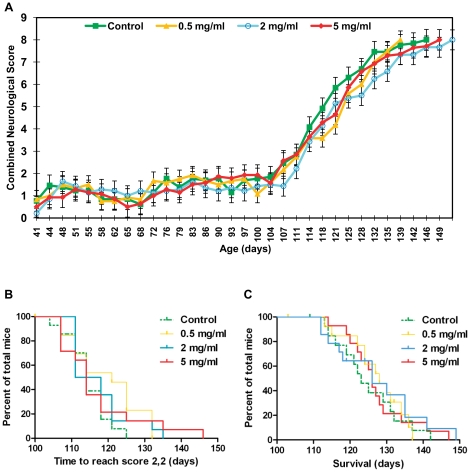
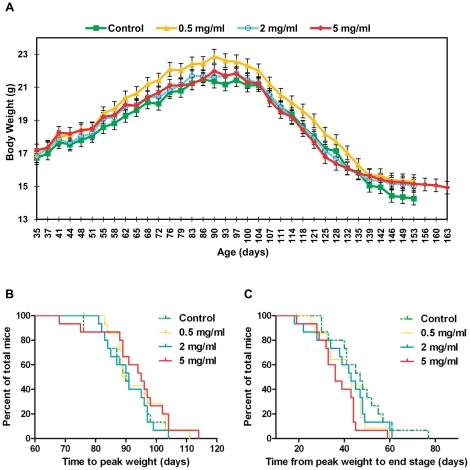
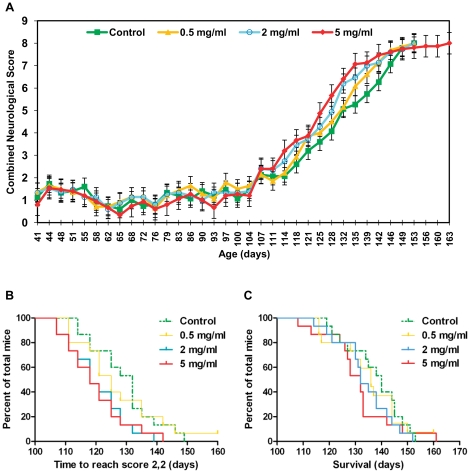
Methodology/principal findings: Treatment of male and female SOD1(G93A) mice (n = ≥6 per sex) with 2 mg/ml metformin in the drinking water from 35 days, resulted in a significant increase in motor unit survival, as measured by in vivo electrophysiology at 100 days, in male EDL muscles (24+/-2 vs. 14+/-2 motor units, p<0.005) and female TA muscles (21+/-1 vs. 15+/-2 motor units, P = 0.0134). We therefore continued to test the effect of 0.5, 2 and 5 mg/ml metformin in the drinking water from 35 days on disease onset and progression (identified by twice weekly determination of weight and neurological score) as well as survival in male and female SOD1(G93A) mice (n = ≥14 per sex). Results for all groups were compared using Kaplan-Meier time to event analyses. In this survival study, metformin was unable to reduce pathology at any dose and had an unexpected dose-dependent negative effect on the onset of neurological symptoms (P = 0.0236) and on disease progression (P = 0.0362) in female mice.
Conclusions/significance: This study suggests that metformin is a poor candidate for clinical trial in ALS patients and that the possibility of harmful effects of metformin in female ALS patients with type II diabetes should be investigated.
Conflict of interest statement
Figures
Similar articles
-
Ablation of P2X7 receptor exacerbates gliosis and motoneuron death in the SOD1-G93A mouse model of amyotrophic lateral sclerosis.Hum Mol Genet. 2013 Oct 15;22(20):4102-16. doi: 10.1093/hmg/ddt259. Epub 2013 Jun 4. Hum Mol Genet. 2013. PMID: 23736299
-
Trehalose decreases mutant SOD1 expression and alleviates motor deficiency in early but not end-stage amyotrophic lateral sclerosis in a SOD1-G93A mouse model.Neuroscience. 2015 Jul 9;298:12-25. doi: 10.1016/j.neuroscience.2015.03.061. Epub 2015 Apr 1. Neuroscience. 2015. PMID: 25841320
-
Fasudil, a rho kinase inhibitor, limits motor neuron loss in experimental models of amyotrophic lateral sclerosis.Br J Pharmacol. 2013 Sep;170(2):341-51. doi: 10.1111/bph.12277. Br J Pharmacol. 2013. PMID: 23763343 Free PMC article.
-
Influence of methylene blue on microglia-induced inflammation and motor neuron degeneration in the SOD1(G93A) model for ALS.PLoS One. 2012;7(8):e43963. doi: 10.1371/journal.pone.0043963. Epub 2012 Aug 27. PLoS One. 2012. PMID: 22952827 Free PMC article.
-
ALSUntangled #68: ozone therapy.Amyotroph Lateral Scler Frontotemporal Degener. 2023 Aug;24(5-6):548-552. doi: 10.1080/21678421.2022.2145904. Epub 2022 Nov 18. Amyotroph Lateral Scler Frontotemporal Degener. 2023. PMID: 36398749 Review.
Cited by
-
The links between diabetes mellitus and amyotrophic lateral sclerosis.Neurol Sci. 2021 Apr;42(4):1377-1387. doi: 10.1007/s10072-021-05099-0. Epub 2021 Feb 5. Neurol Sci. 2021. PMID: 33544228 Free PMC article. Review.
-
Amyotrophic Lateral Sclerosis and Autophagy: Dysfunction and Therapeutic Targeting.Cells. 2020 Nov 4;9(11):2413. doi: 10.3390/cells9112413. Cells. 2020. PMID: 33158177 Free PMC article. Review.
-
Diabetes Mellitus, Obesity, and Diagnosis of Amyotrophic Lateral Sclerosis: A Population-Based Study.JAMA Neurol. 2015 Aug;72(8):905-11. doi: 10.1001/jamaneurol.2015.0910. JAMA Neurol. 2015. PMID: 26030836 Free PMC article.
-
A chemogenomic approach is required for effective treatment of amyotrophic lateral sclerosis.Clin Transl Med. 2022 Jan;12(1):e657. doi: 10.1002/ctm2.657. Clin Transl Med. 2022. PMID: 35064780 Free PMC article. Review.
-
Genetic induction of hypometabolism by ablation of MC4R does not suppress ALS-like phenotypes in the G93A mutant SOD1 mouse model.Sci Rep. 2017 Oct 13;7(1):13150. doi: 10.1038/s41598-017-13304-4. Sci Rep. 2017. PMID: 29030576 Free PMC article.
References
-
- Cozzolino M, Ferri A, Carri MT. Amyotrophic lateral sclerosis: from current developments in the laboratory to clinical implications. Antioxidants & redox signaling. 2008;10:405–443. - PubMed
-
- Rosen DR, Siddique T, Patterson D, Figlewicz DA, Sapp P, et al. Mutations in Cu/Zn superoxide dismutase gene are associated with familial amyotrophic lateral sclerosis. Nature. 1993;362:59–62. - PubMed
-
- Duffy LM, Chapman AL, Shaw PJ, Grierson AJ. The role of mitochondria in the pathogenesis of Amyotrophic Lateral Sclerosis. Neuropathology and Applied Neurobiology. 2011;37:336–352. - PubMed
Publication types
MeSH terms
Substances
Grants and funding
LinkOut - more resources
Full Text Sources
Medical
Molecular Biology Databases
Miscellaneous
