. 2011;6(9):e24195.
doi: 10.1371/journal.pone.0024195. Epub 2011 Sep 1.

Deciphering network community structure by surprise

Affiliations

Deciphering network community structure by surprise

Rodrigo Aldecoa et al. PLoS One. 2011.

Abstract

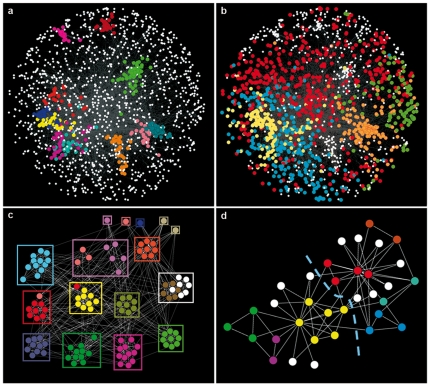
The analysis of complex networks permeates all sciences, from biology to sociology. A fundamental, unsolved problem is how to characterize the community structure of a network. Here, using both standard and novel benchmarks, we show that maximization of a simple global parameter, which we call Surprise (S), leads to a very efficient characterization of the community structure of complex synthetic networks. Particularly, S qualitatively outperforms the most commonly used criterion to define communities, Newman and Girvan's modularity (Q). Applying S maximization to real networks often provides natural, well-supported partitions, but also sometimes counterintuitive solutions that expose the limitations of our previous knowledge. These results indicate that it is possible to define an effective global criterion for community structure and open new routes for the understanding of complex networks.


Conflict of interest statement

Competing Interests: The authors have declared that no competing interests exist.

Figures

Figure 1
Figure 1. Results for open LFR and RC benchmarks.
a) Results for the four standard LFR networks. B and S indicate big and small communities respectively and 1000 or 5000 the number of nodes. μ: mixing parameter. NMI measures the congruence between the known and the deduced community structures. Each point is based on 100 different networks; standard errors of the mean are too small to be visualized. Values for 100 random (R) networks with the same number of units and degree distributions are also shown. b) Comparison of S and Q maximizations in LFR benchmarks. The NMIQ/NMIS ratios, which are almost always below 1, are shown. c) Results for the RC benchmark. The parameter Degradation (D) indicates the percentage of both deleted and shuffled links. Each black dot is based on 100 networks, again standard errors are so small that cannot be visualized at this scale. For each value of D, results for 100 random networks with the same number of links are also shown (open circles). d) Relative quality of the partitions generated by maximizing S and Q in RC benchmarks. As in panel b, NMIQ/NMIS ratios are shown. White dots: results for random networks with different D values.
Figure 2
Figure 2. Average performance of the algorithms in the open LFR and RC benchmarks.
The algorithms used were described by Arnau et al. , Aldecoa and Marín (AM) , Rosvall and Bergstrom (RB) , Ronhovde and Nussinov (RN) , Blondel et al. and Duch and Arenas (DA) . a) Typical example of the results obtained in LFR benchmarks, here with 5000 units and big communities (see Figure S1 for all of them). After ordering the algorithms from best to worst performance, their ranks were added for the 100 different networks. Performance was defined as P = 6 - average rank. Therefore, the maximum value P = 5 means that an algorithm was the best in all networks tested, while P = 0 means that it was always the worst. As it can be observed, none of the algorithms achieved optimal results in all cases. b) Results obtained in the RC benchmark with different Degradation (D) values. Performance evaluated as in panel a).
Figure 3
Figure 3. Results for closed LFR benchmarks.
a) LFR benchmark with 1000 units and big communities. For each Conversion (C) value, NMIs comparing the S max partition with the initial (black dots) or final (red squares) community structures were obtained. The symmetrical results led to NMI averages (blue diamonds) that, with great precision, fell in a straight line of value (1+NMIIF)/2. Dots are based on 100 independent analyses. b–d) LFR benchmarks with, respectively, 1000 units, small communities (b), 5000 units, big communities (c) and 5000 units, small communities (d). Results are very similar to those in panel a). e) Average NMI values for partitions obtained maximizing Q are worse than those obtained maximizing S, especially as we move towards C = 50, in which the real community structure is more difficult to establish. This effect is exacerbated by large number of units and small community sizes, due to the resolution limit of Q. Results for C>50 are symmetrical to the ones shown here. See also Figure S3. f) S max/S orig ratio ≥1, i. e. either the original structure or a different one with higher S is found. These results are compatible with the algorithms used being able to detect the true structure present with great accuracy.
Figure 4
Figure 4. Results for closed RC benchmarks.
Three networks with different heterogeneity in community sizes (Pielou's indexes equal to 0.70, 0.85 and 1.00 respectively) were used as examples. a) PI = 1; b) PI = 0.85; c) PI = 0.70. Results similar to those in Figure 2, except that the figures are not so perfectly symmetrical in the most heterogeneous networks (panels b and c; blue diamonds slightly deviate from the straight line). d) Average NMI values are much worse when Q is used, provided that community sizes are heterogeneous. See also Figure S4. e) S max/S orig<1 with heterogeneous community sizes. The algorithms used did not detect in those cases the maximum possible S, which still may correspond to the initial structure. This may contribute to the departures from symmetry shown in panel a). The fact that S max/S orig≫1 with C<0.50 and PI = 0.70 (blue diamonds) implies that the algorithms are detecting structures different from the initial one.
Figure 5
Figure 5. S max analyses applied to real networks.
Community structure of the CYC2008 network (a, b), College football network (c) and Zachary's karate club network (d), according to S maximization (panels a, c, d) or Q maximization (panel b). In panel c, the known community structure is shown (squares). The broken lines in panel d divide the network into the two communities assumed to exist. That division of the network is not supported at all by S max analyses. While S (2 communities) = 13.61, the optimal division found has S (19 communities) = 25.69. Twelve of these optimal communities are singletons (white dots).

Similar articles

Cited by

References

    1. Barabási AL, Oltvai ZN. Network biology: Understanding the cell's functional organization. Nat Rev Genet. 2004;5:101–113. - PubMed
    1. Wasserman S, Faust K. Social network analysis: Methods and applications. 1994. Cambridge University Press, Cambridge, U.K.
    1. Strogatz SH. Exploring complex networks. Nature. 2001;410:268–276. - PubMed
    1. Costa LD, Rodrigues FA, Travieso G, Boas PRV. Characterization of complex networks: A survey of measurements. Adv Phys. 2007;56:167–242.
    1. Newman MEJ. Networks: An introduction. 2010. Oxford University Press, Oxford. U.K.

Publication types

MeSH terms

Substances