. 2011;6(9):e24308.
doi: 10.1371/journal.pone.0024308. Epub 2011 Sep 1.

Targeting several CAG expansion diseases by a single antisense oligonucleotide

Affiliations

Targeting several CAG expansion diseases by a single antisense oligonucleotide

Melvin M Evers et al. PLoS One. 2011.

Abstract

To date there are 9 known diseases caused by an expanded polyglutamine repeat, with the most prevalent being Huntington's disease. Huntington's disease is a progressive autosomal dominant neurodegenerative disorder for which currently no therapy is available. It is caused by a CAG repeat expansion in the HTT gene, which results in an expansion of a glutamine stretch at the N-terminal end of the huntingtin protein. This polyglutamine expansion plays a central role in the disease and results in the accumulation of cytoplasmic and nuclear aggregates. Here, we make use of modified 2'-O-methyl phosphorothioate (CUG)n triplet-repeat antisense oligonucleotides to effectively reduce mutant huntingtin transcript and protein levels in patient-derived Huntington's disease fibroblasts and lymphoblasts. The most effective antisense oligonucleotide, (CUG)(7), also reduced mutant ataxin-1 and ataxin-3 mRNA levels in spinocerebellar ataxia 1 and 3, respectively, and atrophin-1 in dentatorubral-pallidoluysian atrophy patient derived fibroblasts. This antisense oligonucleotide is not only a promising therapeutic tool to reduce mutant huntingtin levels in Huntington's disease but our results in spinocerebellar ataxia and dentatorubral-pallidoluysian atrophy cells suggest that this could also be applicable to other polyglutamine expansion disorders as well.


Conflict of interest statement

Competing Interests: Judith C.T. van Deutekom and Susan A.M. Mulders report being employed by Prosensa BV. Prosensa BV holds a patent on the use of AONs to reduce CAG and GTG repeat containing transcripts and may (ultimately) benefit from the application of the submitted information. The LUMC does not have any patents on the reported area and has no financial relationship with Prosensa in the field of triplet expansion diseases, nor foresees to benefit otherwise from the use of the reported information. This does not alter the authors' adherence to all the PLoS ONE policies on sharing data and materials.

Figures

Figure 1
Figure 1. Number of CUGs of AON influences the reduction of HTT transcript levels.
Total RNA was isolated 48 hours after transfection. Quantitative RT-PCR was used to measure HTT mRNA levels in control and HD fibroblasts after treatment with 100 nM (CUG)3, (CUG)7, (CUG)12 AON, 100 nM non-htt specific h40AON2 (Control AON), transfection agent only (Mock II), or non-transfected cells (Mock I, not included in this figure). ACTB and RPL22 are used as reference genes. The expression level of Mock I transfections are set to 100%. For all transfections n = 6 and *** P<0.001).
Figure 2
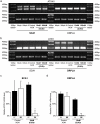
Figure 2. Effect of (CUG)7 AON on HTT mRNA levels in HD patient derived cell lines 48 hours after transfection.
Cells were transfected with 100 nM (CUG)7, non-htt specific h40AON2 (Control AON), transfection agent only (Mock II), or non-transfected cells (Mock I). (a) Agarose gel analysis of the HTT transcript with primers flanking the CAG repeat of control (FLB73) and HD (GM04022) fibroblasts treated with various AONs. Transfection with (CUG)7 shows a decrease of the upper band, representing the transcript from the mutant allele. The lower band, representing the normal HTT transcript, is also reduced, but to a lesser extent. Control cells treated with (CUG)7 only show a slight reduction compared to the control transfections. PCR products with primers for ACTB were used as loading control. gDNA was taken along to control for the PCR reaction over the CAG repeat. (b) Lab-on-a-Chip analysis of HTT transcripts after (CUG)7 treatment in a HD fibroblast cell line. The mutant transcript, with 44 CAGs, is significantly reduced by 83% after (CUG)7 treatment, compared to transfection controls. The normal HTT transcript with 18 CAGs is reduced by 43%. Expression levels are corrected for loading differences with ACTB. The mRNA level of the Mock I transfection was set on 100% (* P<0.05, *** P<0.001, n = 4). (c) Agarose gel analysis of HTT transcripts after (CUG)7 treatment in EBV transformed control and HD human lymphoblasts. After transfection with (CUG)7 the mutant HTT transcript with 45 CAGs is decreased compared to the Mock transfection. No changes in intensity of the HTT transcripts from the control lymphoblasts are seen after (CUG)7 treatment. (d) Lab-on-a-Chip analysis of HTT transcripts after PS57 treatment of human HD lymphoblasts. Mutant HTT transcript is reduced by 46% after (CUG)7 treatment, whereas the normal HTT allele shows an 11% reduction. (n = 2)
Figure 3
Figure 3. (CUG)7 AON reduces mutant htt protein levels in HD patient fibroblast cell lines.
Cells were transfected with 10 nM and 100 nM (CUG)7, non-htt specific h40AON2 (Control AON), or non-transfected cells (Mock I). (a) Western blot of control (FLB73) and HD (GM04022) fibroblasts treated with (CUG)7 and controls. Total (4C8) and mutant (1C2) htt protein expression is reduced 72 hours after treatment with (CUG)7. No mutant htt could be detected in the control fibroblasts with 1C2. β-actin is used as loading control. (b) Mutant htt protein levels in HD (GM04022) fibroblasts after 100 nM (CUG)7 transfection were quantified by ImageJ software. A significant reduction of 58% of mutant htt protein was seen after (CUG)7 transfection as compared to control transfections (* P<0.05, n = 2). Mutant protein levels of Mock I transfection were set to 100%.
Figure 4
Figure 4. Effect of various (CUG)7 AON concentrations on HTT mRNA expression.
Cells were transfected with 1–20 nM (CUG)7. PCR products with primers flanking the CAG repeat of HTT were quantified by Lab on a Chip. (a) In the control cell line (FLB73) both alleles (17 and 21 CAGs) show a comparable concentration dependent reduction of HTT mRNA quantification after (CUG)7 transfection. (b) In HD fibroblasts (GM04022) the mutant transcript, with 44 CAGs, shows a strong reduction of mutant HTT mRNA expression with increasing (CUG)7 AON concentrations, whereas the normal HTT transcript with 18 CAGs is reduced to a lesser degree. Expression levels are corrected for loading differences with ACTB and mRNA levels of the Mock I transfections were set on 100% (* P<0.05, ** P<0.01, n = 4).
Figure 5
Figure 5. (CUG)7 AON reduces mutant ATXN3 mRNA expression in patient-derived fibroblasts.
Cells were transfected with 10 or 100 nM (CUG)7, non-htt specific h40AON2 (Control AON), transfection agent only (Mock II), or non-transfected cells (Mock I). (a) Agarose gel analysis with primers flanking the CAG repeat in the ATXN3 transcript of control (FLB73) and SCA3 (GM06151) fibroblasts after (CUG)7 treatment. After transfection with (CUG)7 the upper band, representing the mutant ATXN3 transcript, is greatly decreased in intensity, while the lower band, representing the wild-type transcript, is only slightly reduced. β-actin was used as loading control. (b) Lab-on-a-Chip analysis of ATXN3 transcripts after 10 nM and 100 nM (CUG)7 treatment in a SCA3 (GM06151) fibroblast cell line. The mutant transcript, with 72 CAGs, is significantly reduced by 97% after (CUG)7 treatment, compared to transfection controls. The normal ATXN3 transcript with 18 CAGs is reduced by 27% and 33% after 10 nM and 100 nM (CUG)7 AON treatment, respectively. Expression levels are corrected for loading differences with β-actin. The mRNA level of the Mock I transfection was set on 100% (* P<0.05, ** P<0.01, n = 2).
Figure 6
Figure 6. (CUG)7 AON reduces mutant ATXN1 and ATN1 transcripts in SCA1 and DRPLA fibroblasts.
SCA1 (GM06927) and DRPLA (GM13716) patient derived fibroblasts were transfected with 10 and 100 nM (CUG)7, 10 nM non-htt specific h40 AON2 (Control AON), transfection agent only (Mock II), or non-transfected cells (Mock I). (a) Agarose gel analysis with primers flanking the CAG repeat in the ATXN1 transcript. After transfection with both 10 nm and 100 nM (CUG)7 the upper band, representing the mutant ATXN1 transcript, is greatly decreased in intensity, while the lower band, representing the wild-type transcript, is not reduced. β-actin was used as loading control. (b) Agarose gel analysis with primers flanking the CAG repeat in the ATN1 transcript. After transfection with both 10 nM and 100 nM (CUG)7, the upper band representing the mutant ATN1 transcript, is greatly decreased in intensity, while the lower band representing the wild-type transcript, is not reduced. β-actin was used as loading control. (c) Lab-on-a-Chip analysis of ATXN1 transcripts in SCA1 cells after control AON and 10 nM (CUG)7 treatment. The mutant transcript, with 72 CAGs, is significantly reduced by 89% after (CUG)7 treatment, compared to transfection controls. The normal ATXN1 transcript with 27 CAGs is not reduced. (d) ImageJ analysis of ATN1 transcripts in DRPLA cells after control AON and 10 nM (CUG)7 treatment. The 66 CAGs containing mutant ATN1 transcript is significantly reduced by 98% after (CUG)7 treatment, while normal ATN1 transcript with 16 CAGs is not significantly reduced by 30%. Expression levels are corrected for loading differences with β-actin. The mRNA level of the Mock I transfection was set on 100% (* P<0.05, ** P<0.01, n = 3).
Figure 7
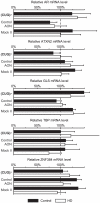
Figure 7. (CUG)7 AON does not affect other CAG-containing transcripts.
Quantitative real-time PCR was used to measure androgen receptor (AR), ataxin-2 (ATXN2), glutaminase (GLS), TATA box binding protein (TBP), and zinc finger protein 384 (ZNF384) mRNA levels in control and HD fibroblasts after treatment with 100 nM (CUG)7, non-htt specific h40AON2 (Control AON), transfection agent only (Mock II), or non-transfected cells (Mock I). All tested CAG-enclosing transcripts were unaffected by (CUG)7 treatment. ACTB and RPL22 are used as reference genes. The expression level of Mock I transfections were set on 100% (n = 6).
Figure 8
Figure 8. (CUG)7 AON does not reduce other polyQ-containing proteins.
Western blot of control (FLB73) fibroblasts treated with 100 nM (CUG)7, non-htt specific h40AON2 (Control AON), and non-transfected (Mock I). TATA box binding protein (TBP) and ataxin-3 are not reduced 72 hours after treatment with (CUG)7. β-actin is used as loading control.

Similar articles

Cited by

References

    1. Cummings CJ, Zoghbi HY. Fourteen and counting: unraveling trinucleotide repeat diseases. Hum Mol Genet. 2000;9:909–916. - PubMed
    1. Nakamura K, Jeong SY, Uchihara T, Anno M, Nagashima K, et al. SCA17, a novel autosomal dominant cerebellar ataxia caused by an expanded polyglutamine in TATA-binding protein. Hum Mol Genet. 2001;10:1441–1448. - PubMed
    1. Bauer PO, Nukina N. The pathogenic mechanisms of polyglutamine diseases and current therapeutic strategies. J Neurochem. 2009;110:1737–1765. - PubMed
    1. Ranen NG, Stine OC, Abbott MH, Sherr M, Codori AM, et al. Anticipation and instability of IT-15 (CAG)n repeats in parent-offspring pairs with Huntington disease. Am J Hum Gen. 1995;57:593–602. - PMC - PubMed
    1. Mcneil SM, Novelletto A, Srinidhi J, Barnes G, Kornbluth I, et al. Reduced penetrance of the Huntington's disease mutation. Hum Mol Genet. 1997;6:775–779. - PubMed

Publication types

MeSH terms