

The threshold bias model: a mathematical model for the nomothetic approach of suicide
- PMID: 21909431
- PMCID: PMC3164734
- DOI: 10.1371/journal.pone.0024414
The threshold bias model: a mathematical model for the nomothetic approach of suicide
Abstract
Background: Comparative and predictive analyses of suicide data from different countries are difficult to perform due to varying approaches and the lack of comparative parameters.
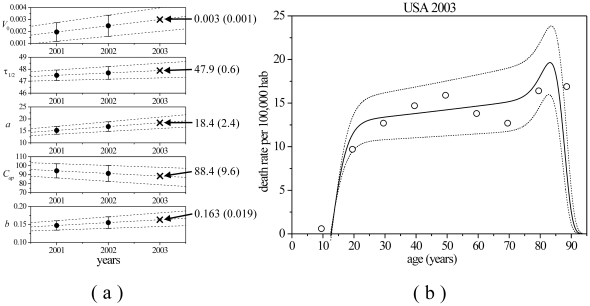
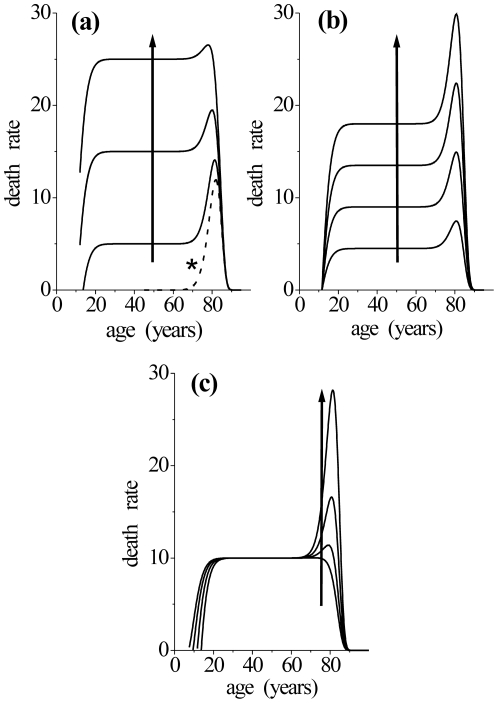
Methodology/principal findings: A simple model (the Threshold Bias Model) was tested for comparative and predictive analyses of suicide rates by age. The model comprises of a six parameter distribution that was applied to the USA suicide rates by age for the years 2001 and 2002. Posteriorly, linear extrapolations are performed of the parameter values previously obtained for these years in order to estimate the values corresponding to the year 2003. The calculated distributions agreed reasonably well with the aggregate data. The model was also used to determine the age above which suicide rates become statistically observable in USA, Brazil and Sri Lanka.
Conclusions/significance: The Threshold Bias Model has considerable potential applications in demographic studies of suicide. Moreover, since the model can be used to predict the evolution of suicide rates based on information extracted from past data, it will be of great interest to suicidologists and other researchers in the field of mental health.
Conflict of interest statement
Figures


Similar articles
-
Risk of suicide and repeat self-harm after hospital attendance for non-fatal self-harm in Sri Lanka: a cohort study.Lancet Psychiatry. 2019 Aug;6(8):659-666. doi: 10.1016/S2215-0366(19)30214-7. Epub 2019 Jul 1. Lancet Psychiatry. 2019. PMID: 31272912 Free PMC article.
-
Demographic risk factors in pesticide related suicides in Sri Lanka.Inj Prev. 2004 Apr;10(2):125. doi: 10.1136/ip.2003.004283. Inj Prev. 2004. PMID: 15066981 Free PMC article. No abstract available.
-
Geospatial, racial, and educational variation in firearm mortality in the USA, Mexico, Brazil, and Colombia, 1990-2015: a comparative analysis of vital statistics data.Lancet Public Health. 2019 Jun;4(6):e281-e290. doi: 10.1016/S2468-2667(19)30018-0. Epub 2019 May 21. Lancet Public Health. 2019. PMID: 31126800
-
Suicide on the Indian subcontinent.Crisis. 2002;23(3):104-7. doi: 10.1027//0227-5910.23.3.104. Crisis. 2002. PMID: 12542107 Review.
-
Suicide prevention strategies in Sri Lanka: the role of socio-cultural factors and health services.Ceylon Med J. 2003 Sep;48(3):68-70. doi: 10.4038/cmj.v48i3.3341. Ceylon Med J. 2003. PMID: 14735799 Review. No abstract available.
Cited by
-
Simulation Models for Suicide Prevention: A Survey of the State-of-the-Art.Computers (Basel). 2023 Jun;12(7):10.3390/computers12070132. doi: 10.3390/computers12070132. Computers (Basel). 2023. PMID: 37869477 Free PMC article.
References
-
- O'Carroll PW. A consideration of the validity and reliability of suicide mortality data. Suicide and Life-Threatening Behavior. 1989;19:1–16. - PubMed
-
- Yip PSF, Liu KY. The ecological fallacy and the gender ratio of suicide in China. British Journal of Psychiatry. 2006;189:465–466. doi: 10.1192/bjp.bp.106.021816. - DOI - PubMed
-
- Rockett IRH, Wang S, Stack S, De Leo D, Frost JL, et al. Race/ethnicity and potential suicide misclassification: Window on a minority suicide paradox? BMC Psychiatry. 2010;10:1–8. doi: 10.1186/1471-244X-10-35. - DOI - PMC - PubMed
-
- Anderson RN, Miniño AM, Fingerhut LA, Warner M, Heinen MA. Deaths: Injuries, 2001. National Vital Statistics Reports 52: 1-88. Centers for Disease Control and Prevention website. 2004. Available: http://www.cdc.gov/nchs/data/nvsr/nvsr52/nvsr52_21acc.pdf. Accessed 2011 Jan 15. - PubMed
Publication types
MeSH terms
LinkOut - more resources
Full Text Sources
Medical
Miscellaneous
