. 2011 Sep;5(9):e1303.
doi: 10.1371/journal.pntd.0001303. Epub 2011 Sep 6.

Serum metabolomics reveals higher levels of polyunsaturated fatty acids in lepromatous leprosy: potential markers for susceptibility and pathogenesis

Affiliations

Serum metabolomics reveals higher levels of polyunsaturated fatty acids in lepromatous leprosy: potential markers for susceptibility and pathogenesis

Reem Al-Mubarak et al. PLoS Negl Trop Dis. 2011 Sep.

Abstract

Background: Leprosy is a disease of the skin and peripheral nervous system caused by the obligate intracellular bacterium Mycobacterium leprae. The clinical presentations of leprosy are spectral, with the severity of disease determined by the balance between the cellular and humoral immune response of the host. The exact mechanisms that facilitate disease susceptibility, onset and progression to certain clinical phenotypes are presently unclear. Various studies have examined lipid metabolism in leprosy, but there has been limited work using whole metabolite profiles to distinguish the clinical forms of leprosy.

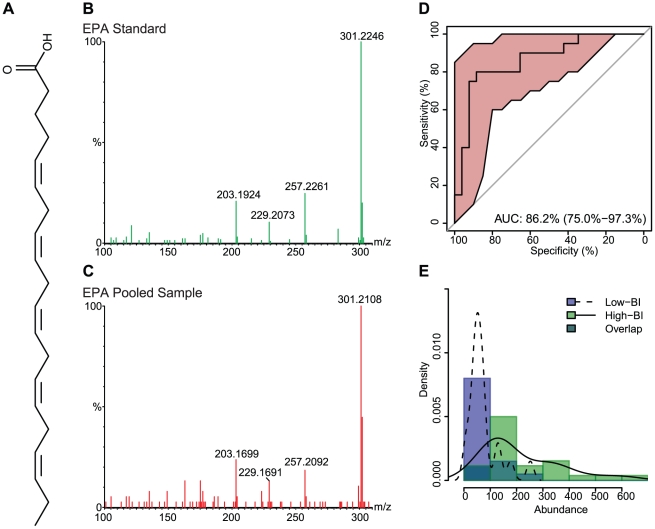
Methodology and principal findings: In this study we adopted a metabolomics approach using high mass accuracy ultrahigh pressure liquid chromatography mass spectrometry (UPLC-MS) to investigate the circulatory biomarkers in newly diagnosed untreated leprosy patients. Sera from patients having bacterial indices (BI) below 1 or above 4 were selected, subjected to UPLC-MS, and then analyzed for biomarkers which distinguish the polar presentations of leprosy. We found significant increases in the abundance of certain polyunsaturated fatty acids (PUFAs) and phospholipids in the high-BI patients, when contrasted with the levels in the low-BI patients. In particular, the median values of arachidonic acid (2-fold increase), eicosapentaenoic acid (2.6-fold increase) and docosahexaenoic acid (1.6-fold increase) were found to be greater in the high-BI patients.

Significance: Eicosapentaenoic acid and docosahexaenoic acid are known to exert anti-inflammatory properties, while arachidonic acid has been reported to have both pro- and anti-inflammatory activities. The observed increase in the levels of several lipids in high-BI patients may provide novel clues regarding the biological pathways involved in the immunomodulation of leprosy. Furthermore, these results may lead to the discovery of biomarkers that can be used to investigate susceptibility to infection, facilitate early diagnosis and monitor the progression of disease.


Conflict of interest statement

The authors have declared that no competing interests exist.

Figures

Figure 1
Figure 1. Principal component analysis of all positive and negative mode m/z values detected in serum of leprosy patients.
A PCA score plot of all positive mode (n = 1668) and negative mode (n = 2489) m/z values collected from UPLC-MS analysis of 23 serum samples (10 low-BI, 13 high-BI). The first two components account for 20.4% of the variation in the data. Duplicate runs of each sample are visible as clustered pairs. A separation of samples is seen based on the BI of the patient.
Figure 2
Figure 2. Eicosapentaenoic acid (EPA) chemical structure, MS/MS spectra, ROC curve and distribution across sample groups.
(A) The chemical structure of EPA. (B) The MS/MS fragmentation pattern for the commercial standard. (C) The MS/MS fragmentation pattern of a representative pooled serum sample. (D) An ROC curve, showing the diagnostic accuracy of EPA in distinguishing low-BI from high-BI samples. The shaded (red) region surrounding the curve represents a 95% confidence interval for sensitivity. The AUC is shown on the graph with a 95% confidence interval in parenthesis. (E) A histogram showing the distribution of EPA in the low-BI and high-BI groups. The overlaid curves show the kernel density estimates for each sample group.
Figure 3
Figure 3. Arachidonic acid (AA) chemical structure, MS/MS spectra, ROC curve and distribution across sample groups.
(A) The chemical structure of AA. (B) The MS/MS fragmentation pattern for the commercial standard. (C) The MS/MS fragmentation pattern of a representative pooled serum sample. (D) An ROC curve, showing the diagnostic accuracy of AA in distinguishing low-BI from high-BI samples. The shaded (red) region surrounding the curve represents a 95% confidence interval for sensitivity. The AUC is shown on the graph with a 95% confidence interval in parenthesis. (E) A histogram showing the distribution of AA in the low-BI and high-BI groups. The overlaid curves show the kernel density estimates for each sample group.
Figure 4
Figure 4. Docosahexaenoic acid (DHA) chemical structure, MS/MS spectra, ROC curve and distribution across sample groups.
(A) The chemical structure of DHA. (B) The MS/MS fragmentation pattern for the commercial standard. (C) The MS/MS fragmentation pattern of a representative pooled serum sample. (D) An ROC curve, showing the diagnostic accuracy of DHA in distinguishing low-BI from high-BI samples. The shaded (red) region surrounding the curve represents a 95% confidence interval for sensitivity. The AUC is shown on the graph with a 95% confidence interval in parenthesis. (E) A histogram showing the distribution of DHA in the low-BI and high-BI groups. The overlaid curves show the kernel density estimates for each sample group.

References

    1. Scollard DM, Adams LB, Gillis TP, Krahenbuhl JL, Truman RW, et al. The continuing challenges of leprosy. Clin Microbiol Rev. 2006;19:338–381. - PMC - PubMed
    1. Scollard DM. The biology of nerve injury in leprosy. Lepr Rev. 2008;79:242–253. - PubMed
    1. World Health Organization. Global leprosy situation, 2010. Wkly Epidemiol Rec. 2010;85:337–348. - PubMed
    1. Moet FJ, Schuring RP, Pahan D, Oskam L, Richardus JH. The prevalence of previously undiagnosed leprosy in the general population of northwest bangladesh. PLoS Negl Trop Dis. 2008;2:e198. - PMC - PubMed
    1. Ridley DS, Jopling WH. Classification of leprosy according to immunity. A five-group system. Int J Lepr Other Mycobact Dis. 1966;34:255–273. - PubMed

Publication types