. 2011:783:139-58.
doi: 10.1007/978-1-61779-282-3_8.

Exploring protein superstructures and dynamics in live bacterial cells using single-molecule and superresolution imaging

Affiliations

Exploring protein superstructures and dynamics in live bacterial cells using single-molecule and superresolution imaging

Julie S Biteen et al. Methods Mol Biol. 2011.

Abstract

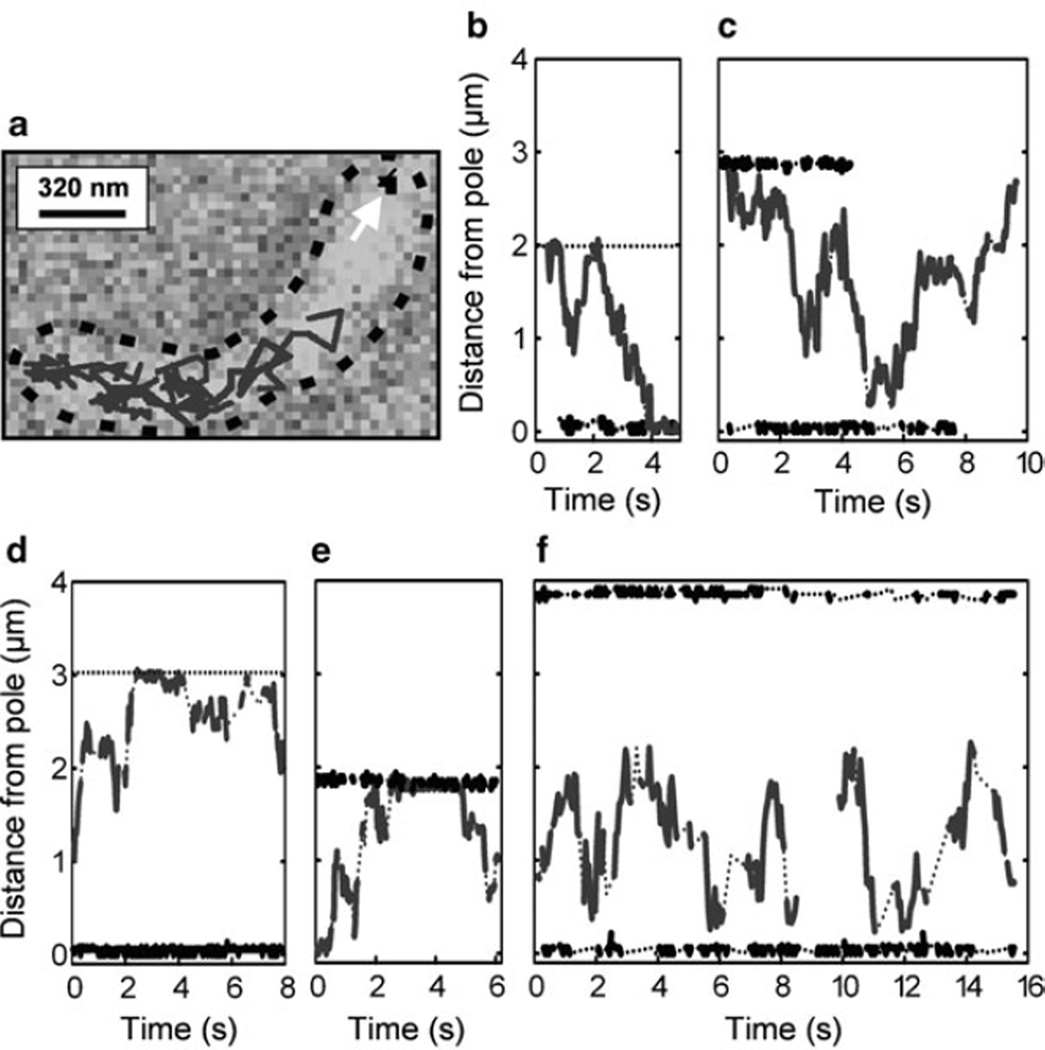
Single-molecule imaging enables biophysical measurements devoid of ensemble averaging, gives enhanced spatial resolution beyond the optical diffraction limit, and enables superresolution reconstruction of structures beyond the diffraction limit. This work summarizes how single-molecule and superresolution imaging can be applied to the study of protein dynamics and superstructures in live Caulobacter crescentus cells to illustrate the power of these methods in bacterial imaging. Based on these techniques, the diffusion coefficient and dynamics of the histidine protein kinase PleC, the localization behavior of the polar protein PopZ, and the treadmilling behavior and protein superstructure of the structural protein MreB are investigated with sub-40-nm spatial resolution, all in live cells.


Figures

Fig. 1
Fig. 1
Schematic of the dynamic localization of the proteins PleC (stars), PopZ (circles), and MreB (lines) over the course of the Caulobacter crescentus cell cycle. PleC is localized to the flagellar pole of the nonreplicating swarmer cell. As the swarmer cell differentiates into a stalked cell, PleC becomes delocalized. As the stalked cell progresses into a predivisional cell, a new flagellum is formed opposite the stalk and PleC is localized to the new flagellar pole. PopZ is also positioned at the flagellar end of swarmer cells. Upon differentiation into a stalked cell, a second concentration of PopZ begins to accumulate at the opposite pole (distal from the stalk) with an intensity that increases as the cell cycle progresses. Prior to the onset of the division process, MreB is arranged in a helix along the longitudinal axis of the cell. As the cell begins cytokinesis, MreB is assembled into a ring at the division plane. The helical structure is then reassembled in the two daughter cells.
Fig. 2
Fig. 2
Dynamics of single PleC histidine kinase molecules. (a–c) Leftmost image: Dark-field image of the cell under investigation. Columns 2–7: Consecutive fluorescence images of single PleC-EYFP molecules spaced by different time intervals: (a) images acquired every 100 ms, (b–c) images acquired every 1 s. (d) Measured mean square displacement (triangles) and geometry-corrected mean square displacement (circles) vs. time lag. The corrected data slope of 0.049 µm2/s corresponds to a diffusion coefficient, D = 12 ± 2 µm2/s. (e) Direction of motion in stalked cells without localized PleC (black bars) and swarmer and predivisional cells with localized PleC (gray bars), where –s indicates motion toward the flagellar pole. Each bin represents one-tenth of the cell length, with the polar bins excluded. Reprinted with permission from ref. .
Fig. 3
Fig. 3
Visualization of single PopZ-YFP molecules in live cells. (a) Positions of two PopZ-EYFP molecules within a cell, with heavy lines tracking the distance moved between 32.2-ms frames. One molecule (black; indicated by arrow at top right) remains localized to the pole, and the other (dark gray) has increased mobility. The tracks are overlaid on a white-light image of the cell, which is outlined in black. (b–f) Time-dependent behavior of 12 single molecules in five cells. Stationary and mobile molecule positions are both tracked with heavy lines. The heavy lines are dotted during dark (blinking-off) periods. Thin horizontal dotted lines in (b) and (d) mark the positions of the poles opposite to the pole at which stationary molecules are localized. The trajectories in (d) correspond to the longitudinal position of the molecules tracked in (a) as a function of time. Reprinted with permission from ref. .
Fig. 4
Fig. 4
Analysis of motion of EYFP-MreB. (a) 15.4-ms integration time fluorescence images of single EYFP-MreB molecules in a C. crescentus cell. White line shows the cell outline. (a1) 15.4-ms epifluorescence image showing three single EYFP-MreB molecules. The top and bottom molecules (arrowheads) are stationary on this timescale, and the middle molecule (arrow) is mobile. (a2) Smoothed image of (a1) obtained by applying a low-pass filter. (a3) Recorded trajectory of the mobile (middle) molecule in (a1). (a4) Summed image of 450 sequential imaging frames. The fluorescence from the two stationary molecules is still evident, whereas the middle molecule does not appear on this 6.93-s integration timescale (scale bar, 1 µm). (b) Measured (open circles) and geometry-corrected (filled circles) MSD of fast-moving MreB molecules. The solid line is a linear fit of the corrected data. (c) Velocity autocorrelation of fast-moving molecules; this quantity drops to zero at the very first time lag. (d) Inverted-contrast, 100-ms integration time fluorescence images of single slow-moving EYFP-MreB molecules in a C. crescentus cell at 30-s intervals. The arrows illustrate the directional movement of the molecules and the black line shows the cell outline. The superlocalized track of a single molecule leads to a superresolution image of the filament through which the molecule is treadmilling. (e) Measured MSD versus time lag for slow-moving MreB molecules. The solid line is a quadratic fit to the data, indicative of directional motion. (f) Velocity autocorrelation of slow-moving MreB; this quantity remains positive over at least 80 s. Reprinted with permission from ref. .
Fig. 5
Fig. 5
Superresolution imaging of MreB superstructure. (a–f) Reactivation of single EYFP-MreB fusions in the same live C. crescentus cell using 407-nm light. Fluorescence images of single EYFP-MreB molecules from 514-nm excitation are overlaid on a reversed-contrast, white-light image of the cell. (a) Initial image showing two isolated emissive EYFP-MreB molecules. (b, d, f) After photobleaching by 514-nm irradiation, the cell contains no emissive EYFP-MreB. (c, e) Reactivated EYFP-MreB molecules are observed following a short 407-nm reactivation pulse (scale bar, 1 µm). (g–j) TL-PALM images of EYFP-MreB in C. crescentus cells created by fitting molecule positions in imaging frames, such as those in (a), (c), and (e). (g, h) Quasi-helical structure in a stalked cell. (i, j) Midplane ring in a predivisional cell. Fluorescence PALM images are shown in (g) and (i). The PALM images in (h) and (j) are from the same cells as in (g) and (i), respectively, overlaid on a reversed-contrast, white-light image of the cell (scale bars, 300 nm). Reprinted with permission from ref. .

Similar articles

Cited by

References

    1. Ambrose WP, Moerner WE. Fluorescence spectroscopy and spectral diffusion of single impurity molecules in a crystal. Nature. 1991;349:225–227.
    1. Thompson RE, Larson DR, Webb WW. Precise nanometer localization analysis for individual fluorescent probes. Biophys J. 2002;82:2775–2783. - PMC - PubMed
    1. Schütz GJ, Kada G, Pastushenko VP, Schindler H. Properties of lipid microdomains in a muscle cell membrane visualized by single molecule microscopy. EMBO J. 2000;19:892–901. - PMC - PubMed
    1. Sako Y, Minoghchi S, Yanagida T. Single-molecule imaging of EGFR signalling on the surface of living cells. Nat Cell Biol. 2000;2:168–172. - PubMed
    1. Moerner WE. Optical measurements of single molecules in cells. Trends Anal Chem. 2003;22:544–548.

Publication types

MeSH terms

Substances

LinkOut - more resources