. 2011 Oct 18;50(41):8970-81.
doi: 10.1021/bi200935d. Epub 2011 Sep 21.

Kinetic and thermodynamic features reveal that Escherichia coli BCP is an unusually versatile peroxiredoxin

Affiliations

Kinetic and thermodynamic features reveal that Escherichia coli BCP is an unusually versatile peroxiredoxin

Stacy A Reeves et al. Biochemistry. .

Abstract

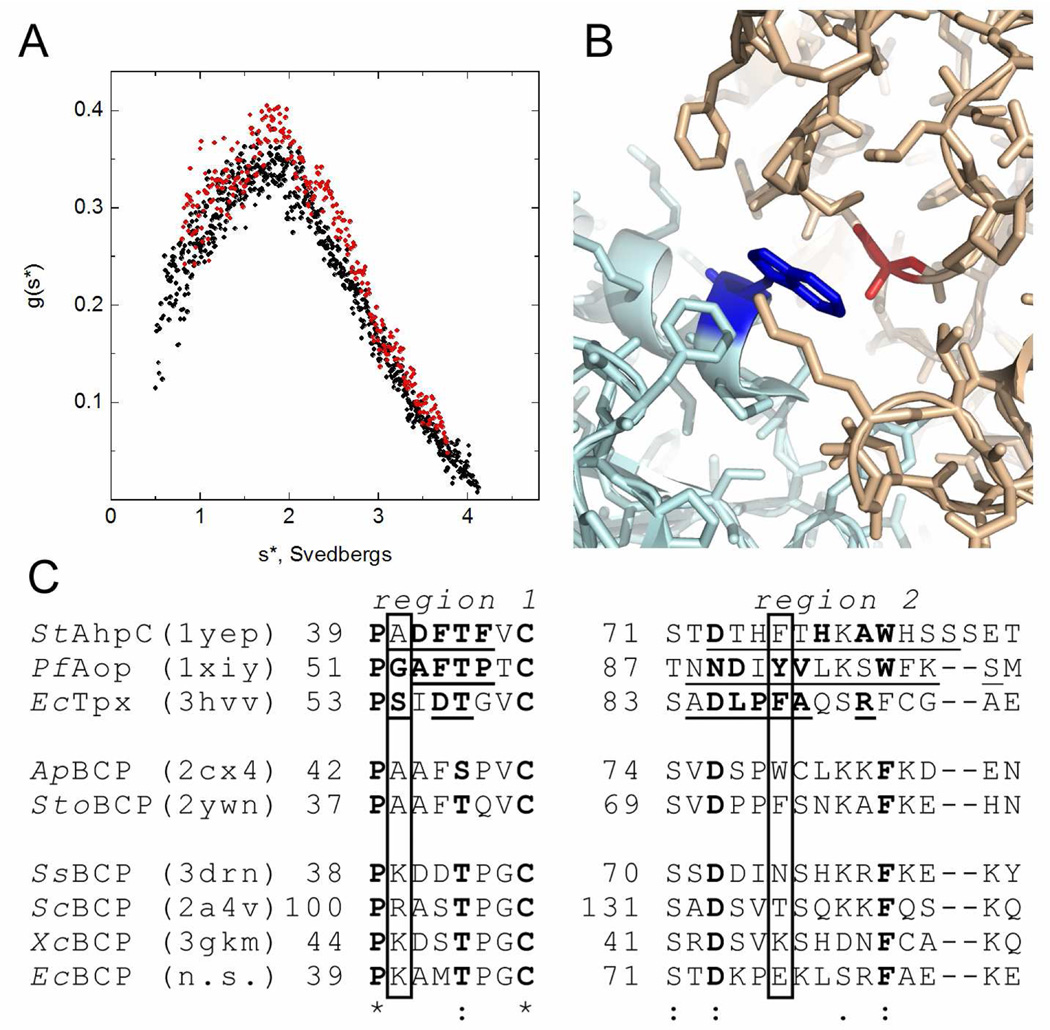
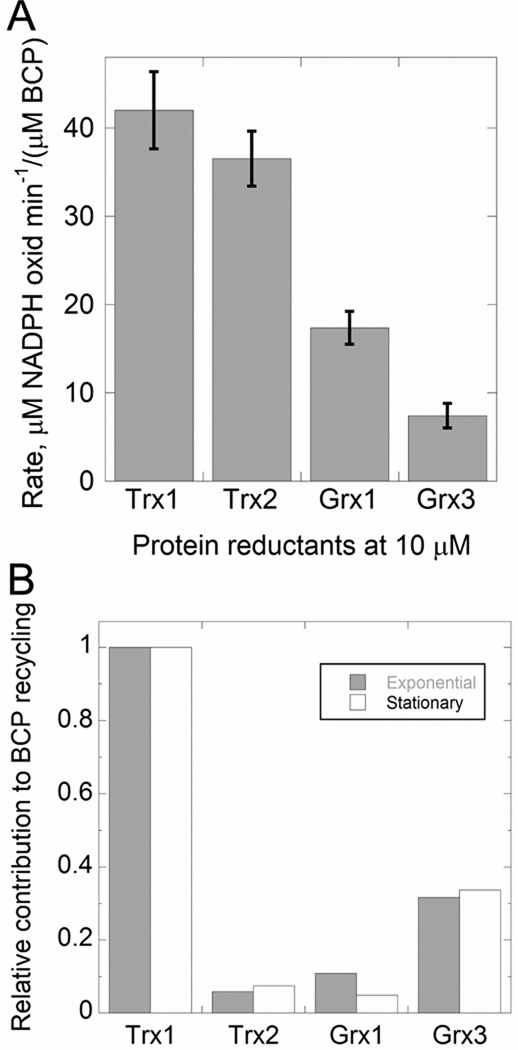
In Escherichia coli, bacterioferritin comigratory protein (BCP) is a peroxiredoxin (Prx) that catalyzes the reduction of H(2)O(2) and organic hydroperoxides. This protein, along with plant PrxQ, is a founding member of one of the least studied subfamilies of Prxs. Recent structural data have suggested that proteins in the BCP/PrxQ group can exist as monomers or dimers; we report here that, by analytical ultracentrifugation, both oxidized and reduced E. coli BCP behave as monomers in solution at concentrations as high as 200 μM. Unexpectedly, thioredoxin (Trx1)-dependent peroxidase assays conducted by stopped-flow spectroscopy demonstrated that V(max,app) increases with increasing Trx1 concentrations, indicating a nonsaturable interaction (K(m) > 100 μM). At a physiologically reasonable Trx1 concentration of 10 μM, the apparent K(m) value for H(2)O(2) is ~80 μM, and overall, the V(max)/K(m) for H(2)O(2), which remains constant at the various Trx1 concentrations (consistent with a ping-pong mechanism), is ~1.3 × 10(4) M(-1) s(-1). Our kinetic analyses demonstrated that BCP can utilize a variety of reducing substrates, including Trx1, Trx2, Grx1, and Grx3. BCP exhibited a high redox potential of -145.9 ± 3.2 mV, the highest to date observed for a Prx. Moreover, BCP exhibited a broad peroxide specificity, with comparable rates for H(2)O(2) and cumene hydroperoxide. We determined a pK(a) of ~5.8 for the peroxidatic cysteine (Cys45) using both spectroscopic and activity titration data. These findings support an important role for BCP in interacting with multiple substrates and remaining active under highly oxidizing cellular conditions, potentially serving as a defense enzyme of last resort.


Figures

Figure 1
Figure 1. The monomeric nature of E. coli BCP, confirmed by sedimentation velocity studies, is consistent with non-conserved residues within the region of the A-type interface
As shown in panel A, analytical ultracentrifugation studies of E. coli BCP at 42,000 rpm, 20 °C, and neutral pH show no evidence of the formation of dimers or higher multimers using 50 µM concentrations of reduced (red), and oxidized (black) wild-type BCP. SVEDBERG software was used to generate the g*(s) distributions shown in panel A, and to fit the data to a single-species model, yielding molecular weights derived from extrapolated and corrected s and D values of 19.4 kDa for reduced and 22.2 kDa for oxidized BCP. Panel B depicts the A-type interface between dimers in Aeropyrum pernix BCP (PDB code 2cx4), with one monomer in light blue and the other in tan. Comparing monomeric BCPs (bottom of panel C) with the two dimeric BCPs (middle two lines) and members of three other A-type interface-containing Prx subfamilies (upper part of panel C), it is notable that the dimeric proteins possess a conserved aromatic residue in region 2 (Trp79 in A. pernix BCP, blue residue in panel B), and a conserved small, mostly hydrophobic residue in region 1 (Ala43 in A. pernix BCP, red residue in panel B); these positions in E. coli BCP and three other monomeric BCPs instead have hydrophilic and mostly charged residues, consistent with their exposure to solvent in these monomers. Conserved residues within the given subfamilies (shown in bold) and those within A interfaces (underlined) in the top three proteins were identified in a bioinformatics and structural analysis of subfamily members across all Prxs identified from a search of the January 2008 release of GenBank (January 2009 for BCP/PrxQ subfamily members) (6). Representative proteins shown are from Salmonella typhimurium (St), Plasmodium falciparum (Pf), E. coli (Ec), A. pernix (Ap), Sulfolobus tokadaii (Sto), Sulfolobus solfataricus (Ss), Saccharomyces cerevisiae (Sc), and Xanthomonas campestris (Xc). n.s. indicates that there are no structural data available for EcBCP.
Figure 2
Figure 2. Steady state kinetic analyses of E. coli BCP with H2O2 and Trx1
Peroxidase activity was measured by mixing various concentrations of E. coli Trx1 (prereduced by DTT) and BCP (0.5 µM) in 50 mM potassium phosphate at pH 7.0 (with 0.5 mM EDTA) with various concentrations of H2O2 in a stopped-flow spectrophotometer at 25 °C. The decrease in Trx fluorescence due to oxidation was monitored using a stopped flow spectrofluorometer and converted to initial rates as described in Experimental Procedures. Fixed concentrations of Trx1 assayed over a range of H2O2 concentrations were 10 µM (closed circles), 20 µM (open circles), 40 µM (closed squares), and 80 µM (open squares). Data shown in A (plus or minus standard error) are the averages of three independent replicates. Lines through the points show the direct fits to the Michaelis-Menten equation for each Trx1 concentration. B. Secondary plot of 1/Vmax,app vs. 1/[Trx] from data shown in panel A and Table S1. C. Hanes-Woolf plot of [H2O2]/v vs. [H2O2] from data shown in panel A and Table S1. Lines intersecting at the y-axis are consistent with a substituted (ping-pong) enzyme mechanism.
Figure 3
Figure 3. Reductants of E. coli BCP
Thioredoxin (Trx) and glutaredoxin (Grx) proteins from E. coli were assayed with BCP in a common buffer that differed only in the appropriate regeneration system for each (Trx reductase, or glutathione reductase and glutathione, respectively). Assays were conducted in 50 mM phosphate buffer (pH 7.0) with 1 mM EDTA, 150 µM NADPH, 0.5 µM BCP, 1 mM cumene hydroperoxide, and 10 µM Trx1, Trx2, Grx1 or Grx3. For Trx-linked assays, 0.3 µM E. coli Trx reductase was also added; the Grx-linked assays were supplemented instead with 1 mM reduced glutathione and 1 U/mL glutathione reductase. Activity was monitored spectrophotometrically at 340 nm and initial rates were used to calculate the amount of NADPH oxidized per min normalized to the amount of BCP added. Shown are averages from at least three experiments ± standard error. Also tested was a reductant system including NADH and AhpF in addition to the BCP and peroxide, but no activity was observed and thus this result is not included in the plot. In panel B, abundance in ng/mL for each protein (66) was multiplied by the rate reported in panel A, and the product was normalized to 1.0 for Trx1.
Figure 4
Figure 4. HPLC profile of the separation of equilibrated reduced and oxidized forms of E. coli BCP and DsbA to determine redox potential
Reduced and oxidized BCP and DsbA (each at 50 µM) were allowed to equilibrate at room temperature in 100 mM potassium phosphate, pH 7.0, with 1 mM EDTA. The protein mixtures were quenched with N-ethylmaleimide and phosphoric acid and immediately separated by HPLC as described under “Experimental Procedures.” Shown are the chromatograms from mixing reduced BCP with oxidized DsbA (red), and, displaced by 7 min and 0.01 absorbance units for ease of viewing, reduced DsbA mixed with oxidized BCP (blue).
Figure 5
Figure 5. Effects of pH on absorbance at 240 nm (panels A and B), and activity measured by the FOX assay (panel B) for BCP proteins
To generate data shown in both panels, the A240 and A280 values for reduced BCP (25 µM) were measured over a range of pH values and converted to ε240 as described in Experimental Procedures. Assuming the change in absorbance reflects a simple thiolate:thiol equilibrium, the pKa values were calculated from the plot of ε240 versus pH by direct fit to Equation 3. Values shown are for wild type (red circles), C50S (blue squares) and C50,99S (black triangles) BCP, along with the respective pKa fit curves (solid red, solid blue and dotted black, respectively). Data for C45S (green triangles) and oxidized wild type BCP (open circles) are also shown. In panel B, peroxide reduction rates (right axis) were assessed using the FOX assay to measure peroxide levels after rapid mixing with BCP (over a time course of 1 to 15 s), monitoring the decrease in absorbance at 560 nm after addition of the reagent (open circles and dotted line for the fit to Equation 3). These data are overlaid with the data from panel A with wild type, reduced BCP (closed circles and solid line) to illustrate the agreement between these independently-derived apparent pKa values.

References

    1. Imlay JA. Cellular defenses against superoxide and hydrogen peroxide. Annu Rev Biochem. 2008;77:755–776. - PMC - PubMed
    1. Eschenbach DA, Davick PR, Williams BL, Klebanoff SJ, Young-Smith K, Critchlow CM, Holmes KK. Prevalence of hydrogen peroxide-producing Lactobacillus species in normal women and women with bacterial vaginosis. J Clin Microbiol. 1989;27:251–256. - PMC - PubMed
    1. Miller RA, Britigan BE. Role of oxidants in microbial pathophysiology. Clin Microbiol Rev. 1997;10:1–18. - PMC - PubMed
    1. Ryan CS, Kleinberg I. Bacteria in human mouths involved in the production and utilization of hydrogen peroxide. Arch Oral Biol. 1995;40:753–763. - PubMed
    1. Baker LM, Poole LB. Catalytic mechanism of thiol peroxidase from Escherichia coli. Sulfenic acid formation and overoxidation of essential CYS61. J Biol Chem. 2003;278:9203–9211. - PMC - PubMed

Publication types

LinkOut - more resources