. 2011 Oct;166(1):110-20.
doi: 10.1111/j.1365-2249.2011.04453.x.

The multi-hit hypothesis of primary biliary cirrhosis: polyinosinic-polycytidylic acid (poly I:C) and murine autoimmune cholangitis

Affiliations

The multi-hit hypothesis of primary biliary cirrhosis: polyinosinic-polycytidylic acid (poly I:C) and murine autoimmune cholangitis

Y M Ambrosini et al. Clin Exp Immunol. 2011 Oct.

Abstract

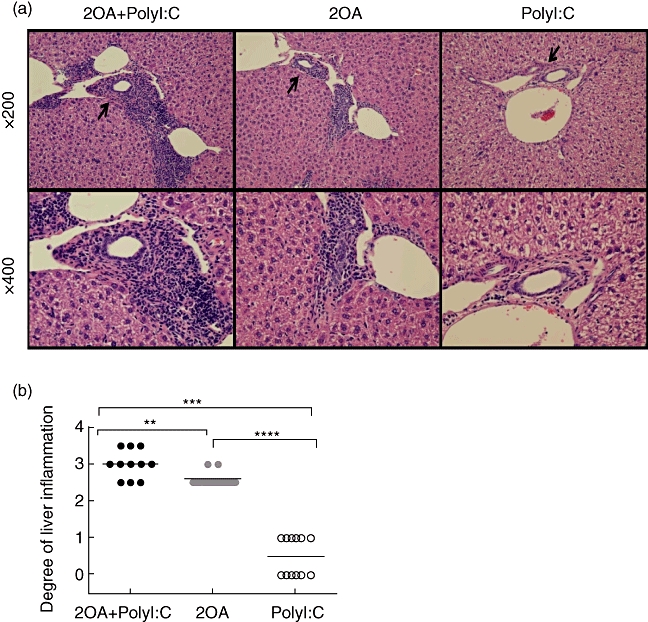
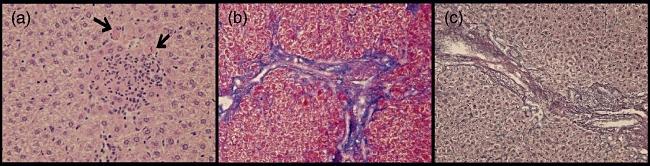
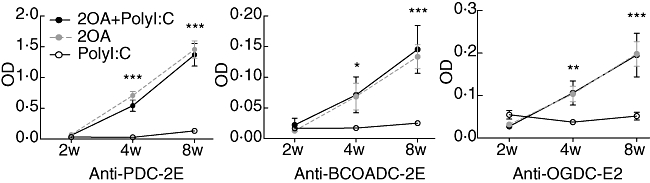
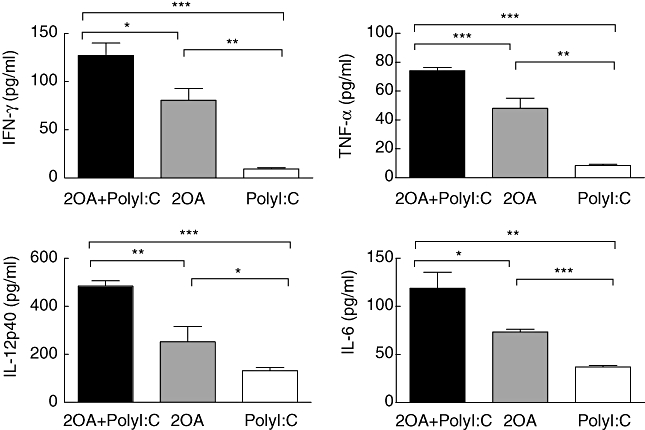
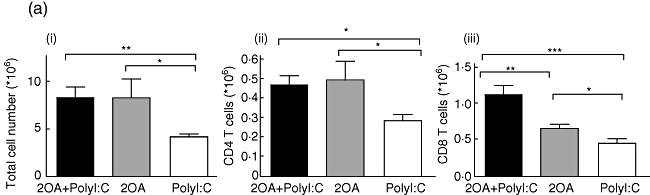
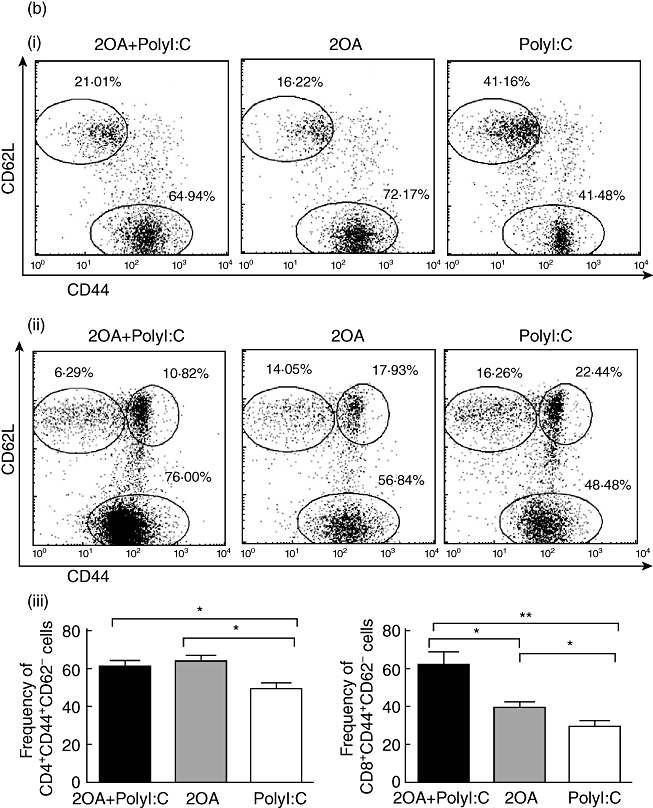
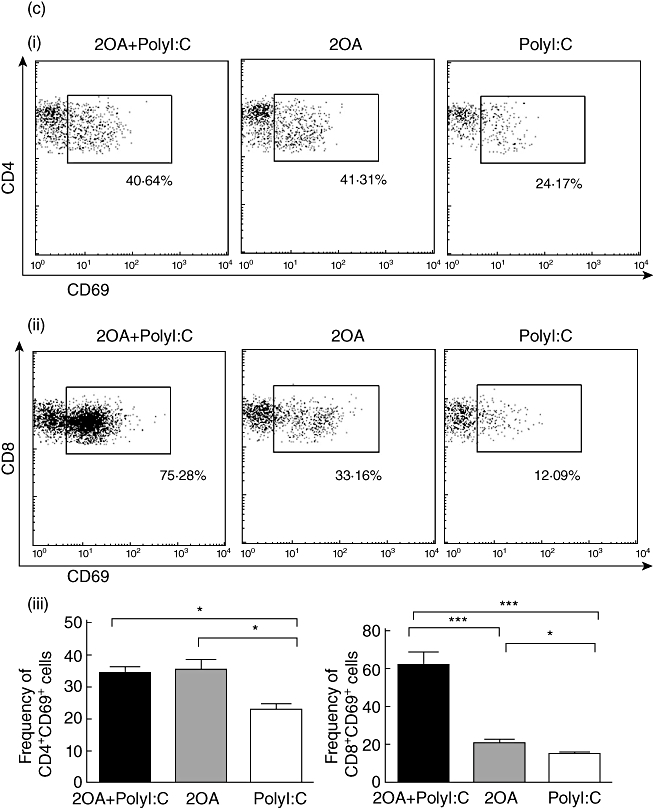
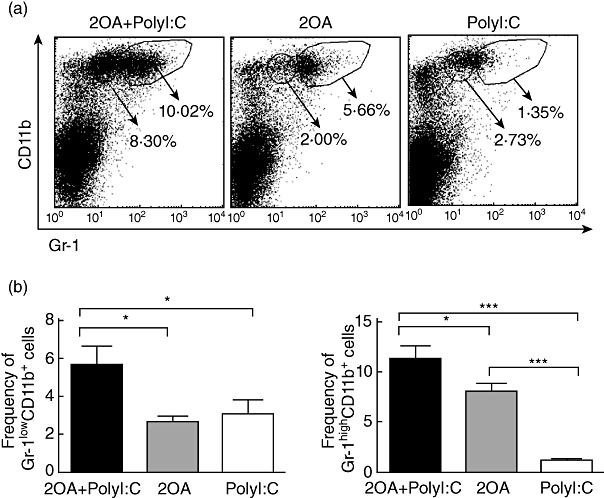
A void in understanding primary biliary cirrhosis (PBC) is the absence of appropriate animal models. Our laboratory has studied a murine model of autoimmune cholangitis induced following immunization with 2-octynoic acid (2OA), an antigen identified following extensive quantitative structural activity relationship (QSAR) analysis, using human autoantibodies and three-dimensional analysis of the mitochondrial autoantigen, the E2 subunit of the pyruvate dehydrogenase complex (PDC-E2). Mice immunized with 2OA coupled to bovine serum albumin (BSA) develop anti-mitochondrial antibodies (AMAs) of the identical specificity as humans with PBC, and in addition develop inflammatory portal cell infiltrates in liver. However, the natural history of disease is less severe than in humans and does not include fibrosis. Data from human and autoimmune murine models suggest that environmental and/or infectious agents can exacerbate autoimmune reactions, and a model of PBC has been described in which polyinosinic-polycytidylic acid (poly I:C), a viral RNA mimetic and Toll-like receptor 3 (TLR-3) agonist induces low-titre AMAs and in mild portal infiltrates. We took advantage of our established model to determine whether immunization with 2OA-BSA coupled with poly I:C alters the disease process. Indeed, the addition of poly I:C produces a profound exacerbation of autoimmune cholangitis, including a significant increase in CD8(+) infiltrating T cells, as well as a marked increase of proinflammatory cytokines. In addition, mice have evidence of fibrosis. These findings lend support to the concept that besides breakdown of self-tolerance, there is a requirement of a second 'hit' during the breakdown process that leads to disease which more faithfully mimics human PBC.


Figures

Fig. 1
Fig. 1
(a) Haematoxylin and eosin-stained tissue sections of livers from 2OA+polyinosinic-polycytidylic acid (poly I:C)-, 2OA-, poly I:C-treated mice at 8 weeks post-immunization. Infiltration of lymphocytes in portal tracts, particularly surrounding intralobular bile ducts (black arrow) were observed in the liver of both 2OA+poly I:C- and 2OA-treated mice, but none in poly I:C-treated mice. (b) The degree of liver inflammation is presented and compared for 2OA+poly I:C- (black dot; n = 11), 2OA- (grey dot; n = 11), poly I:C (white dot; n = 12)-treated mice at 8 weeks post-immunization. *P < 0·05; **P < 0·01; ***P < 0·001 (Mann–Whitney U-test).
Fig. 2
Fig. 2
Microscopic examination of liver tissue from 2OA+polyinosinic-polycytidylic acid (poly I:C)-treated mice at 8 weeks post-immunization. Eosinophil infiltration (black arrow) was observed only in this group (haematoxylin and eosin × 400). Fibrosis formation was evaluated further with Azan (b, × 400) and silver staining (c, × 400) of liver sections from 2OA+poly I:C-treated mice at 8 weeks post- immunization.
Fig. 3
Fig. 3
Quantification of serological anti-E2 subunit of the pyruvate dehydrogenase complex (PDC-E2), anti-branched chain 2-oxo acid dehydrogenase complex (BCOADC-E2) and anti-E2 subunit of the 2-oxoglutarate dehydrogenase complex (OGDC-E2) reactivity by enzyme-linked immunosorbent assay (ELISA) at 2, 4 and 8 weeks after immunization. *P < 0·05; **P < 0·01; ***P < 0·001.
Fig. 4
Fig. 4
Serum concentration of interleukin (IL)-6, interferon (IFN)-γ, tumour necrosis factor (TNF)-α and IL-12p40 at 4 weeks after the immunization with 2-octynoic acid (2OA)-bovine serum albumin (BSA) conjugate with polyinosinic-polycytidylic acid (poly I:C) administration (n = 6) compared with 2OA-BSA alone (n = 4) and poly I:C alone (n = 6). *P < 0·05; **P < 0·01; ***P < 0·001.
Fig. 5
Fig. 5
(a) The absolute numbers of total intrahepatic lymphocytes, hepatic CD4+ and CD8+ T cells were compared among 2OA+polyinosinic-polycytidylic acid (poly I:C) (n = 6), 2OA (n = 7), and poly I:C-treated mice (n = 8) at 8 weeks-post-immunization. *P < 0·05; **P < 0·01; ***P < 0·001. (b) Flow cytometric analysis of intrahepatic lymphocytes from 2OA+poly I:C (n = 6), 2OA (n = 7) and poly I:C-treated mice (n = 8) at 8 weeks post-immunization. Displayed in the dot-plots are cells gated on natural killer (NK)1·1- T cell receptor (TCR)-β+ T cell population. Numbers in the dot plots are percentages of cells in the specific gates out of the grated (i) CD4+ T cell population and (ii) CD8+ T cell population. The frequencies of (iii) CD4+CD44+CD62L- and CD8+CD44+CD62L- T cells were compared. *P < 0·05; **P < 0·01. (c) Flow cytometric analysis of intrahepatic lymphocytes from 2OA+poly I:C (n = 6), 2OA (n = 7) and poly I:C-treated mice (n = 8) at 8 weeks post-immunization. Displayed in the dot-plots are cells gated on NK1·1-TCR-β+ T cell population. Numbers in the dot-plots are percentages of cells in the specific gates of the gated (i) CD4+ T cell population and (ii) CD8+ T cell population. The frequencies of (iii) CD4+CD69+ and CD8+CD69+ T cells were compared. *P < 0·05; ***P < 0·001.
Fig. 5
Fig. 5
(a) The absolute numbers of total intrahepatic lymphocytes, hepatic CD4+ and CD8+ T cells were compared among 2OA+polyinosinic-polycytidylic acid (poly I:C) (n = 6), 2OA (n = 7), and poly I:C-treated mice (n = 8) at 8 weeks-post-immunization. *P < 0·05; **P < 0·01; ***P < 0·001. (b) Flow cytometric analysis of intrahepatic lymphocytes from 2OA+poly I:C (n = 6), 2OA (n = 7) and poly I:C-treated mice (n = 8) at 8 weeks post-immunization. Displayed in the dot-plots are cells gated on natural killer (NK)1·1- T cell receptor (TCR)-β+ T cell population. Numbers in the dot plots are percentages of cells in the specific gates out of the grated (i) CD4+ T cell population and (ii) CD8+ T cell population. The frequencies of (iii) CD4+CD44+CD62L- and CD8+CD44+CD62L- T cells were compared. *P < 0·05; **P < 0·01. (c) Flow cytometric analysis of intrahepatic lymphocytes from 2OA+poly I:C (n = 6), 2OA (n = 7) and poly I:C-treated mice (n = 8) at 8 weeks post-immunization. Displayed in the dot-plots are cells gated on NK1·1-TCR-β+ T cell population. Numbers in the dot-plots are percentages of cells in the specific gates of the gated (i) CD4+ T cell population and (ii) CD8+ T cell population. The frequencies of (iii) CD4+CD69+ and CD8+CD69+ T cells were compared. *P < 0·05; ***P < 0·001.
Fig. 6
Fig. 6
Flow cytometric analysis of intrahepatic lymphocytes from 2OA+polyinosinic-polycytidylic acid (poly I:C) (n = 6), 2OA (n = 7) and poly I:C-treated mice (n = 8) at 8 weeks-post-immunization. (a) Displayed in the dot plots are cells gated on the lymphocyte population. Numbers in the dot-plots are percentages of cells in the specific gates out of the grated lymphocyte population. The frequencies of (b) Gr-1lowCD11b+ and Gr-1highCD11b+ cells were compared. *P < 0·05; ***P < 0·001.
Fig. 7
Fig. 7
Activation of liver natural killer (NK) cells after 2 OA-immunization. At 1 and 8 weeks post-immunization, mice were killed and liver mononuclear cells were isolated and stained with monoclonal antibodies, as described. CD69 expression on NK1·1+ T cell receptor (TCR)-β- NK cells was analysed by flow cytometry. *P < 0·05; ***P < 0·001.

References

    1. Kaplan MM, Gershwin ME. Primary biliary cirrhosis. N Engl J Med. 2005;353:1261–73. - PubMed
    1. Wakabayashi K, Lian ZX, Leung PS, et al. Loss of tolerance in C57BL/6 mice to the autoantigen E2 subunit of pyruvate dehydrogenase by a xenobiotic with ensuing biliary ductular disease. Hepatology. 2008;48:531–40. - PMC - PubMed
    1. Wakabayashi K, Yoshida K, Leung PS, et al. Induction of autoimmune cholangitis in non-obese diabetic (NOD).1101 mice following a chemical xenobiotic immunization. Clin Exp Immunol. 2009;155:577–86. - PMC - PubMed
    1. Ueno Y, Ambrosini YM, Moritoki Y, Ridgway WM, Gershwin ME. Murine models of autoimmune cholangitis. Curr Opin Gastroenterol. 2010;26:274–9. - PubMed
    1. Amano K, Leung PS, Rieger R, et al. Chemical xenobiotics and mitochondrial autoantigens in primary biliary cirrhosis: identification of antibodies against a common environmental, cosmetic, and food additive, 2-octynoic acid. J Immunol. 2005;174:5874–83. - PubMed

MeSH terms