

doi: 10.1073/pnas.1113249108.
Epub 2011 Sep 12.
Dynamics and control of state-dependent networks for probing genomic organization
Affiliations
- PMID: 21911407
- PMCID: PMC3198315
- DOI: 10.1073/pnas.1113249108
Item in Clipboard
Dynamics and control of state-dependent networks for probing genomic organization
Proc Natl Acad Sci U S A.
.
Abstract
A state-dependent dynamic network is a collection of elements that interact through a network, whose geometry evolves as the state of the elements changes over time. The genome is an intriguing example of a state-dependent network, where chromosomal geometry directly relates to genomic activity, which in turn strongly correlates with geometry. Here we examine various aspects of a genomic state-dependent dynamic network. In particular, we elaborate on one of the important ramifications of viewing genomic networks as being state-dependent, namely, their controllability during processes of genomic reorganization such as in cell differentiation.
Conflict of interest statement
The authors declare no conflict of interest.
Figures
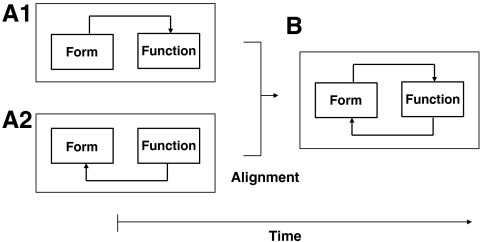
Mechanics of cell specialization. (A1, A2, and B) The relationship between spatial (form) and transcriptional (function) networks over time during cell specialization. Alignment of the networks, where the architecture and transcriptional networks become mutually related. Prior to the aligned state, we propose two possible models: (A1) overall coregulated gene content emerges according to overall chromosome associations, or form precedes function, and (A2) the transcriptional network and coregulated genes precede and shape the architecture network, or form follows function. (B) After alignment, feedback between form and function networks allows fine-tuning to achieve optimal cell-specific network configurations.
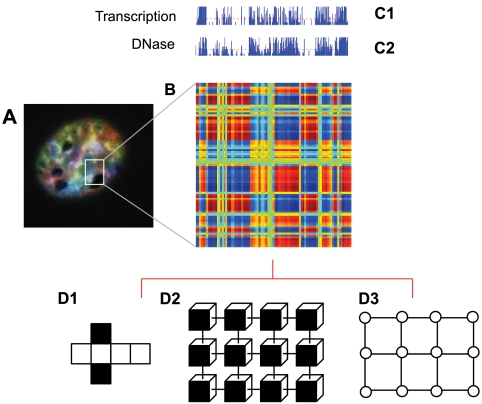
The open and closed chromatin domains throughout the genome occupy different spatial compartments in the nucleus. (A) Image of an interphase nucleus labeled by spectral karyotyping (SKY). All chromosomes are labeled with a unique color to visualize their territories. Analysis of SKY data reveal spatial relationships between each pair of chromosomes. (B) Correlation map of a chromosome generated from Hi-C. A correlation matrix illustrates the correlation [range from 1 (blue) to +1 (red)] between the intrachromosomal interaction profiles of every pair of 1-Mb segments along each chromosome. (C1) The transcription profile along the chromosome. (C2) The open and closed chromatin profile along the chromosome (based on DNase I hypersensitivity). The two dominant proximity patterns, red and blue, correlate strongly with open and closed chromatin. (D1–D3) A state-dependent network representation of proximity patterns. The faces of each element are color-coded (D1); the elements can exchange information when the same color-coded sides are facing each other (D2); the interaction graph associated with D1 (D3).
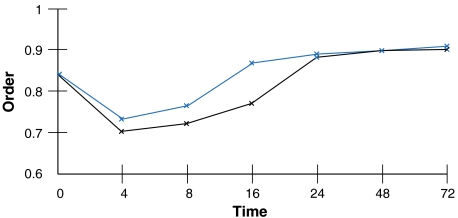
Dynamics of order during cell specialization. When a progenitor commits to either the erythroid (black) or the neutrophil lineage (blue), there is a concomitant increase in order, eventually stabilizing at a level greater than that of the original multipotent progenitor (7).
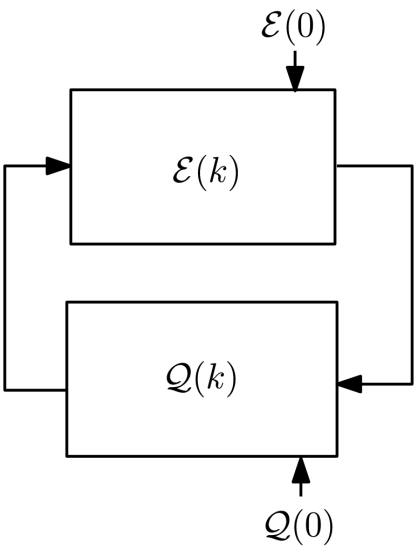
Feedback between cell function and cell proximity network; the initial conditions  and
and  are determined following an intricate alignment between form and function.
and are determined following an intricate alignment between form and function.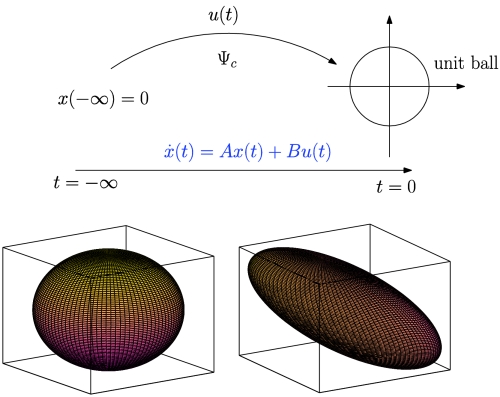
Controllability Gramian characterizes the minimum energy input to the linear system  that steers the initial zero state at infinite past to a point on the unit ball at t = 0 (Top). Moreover, this Gramian defines how inputs on the unit sphere (Bottom Left), such as noise or external signals, map to system states: Directions that are more controllable are characterized by elongated ellipsoidal axes, whereas the shortened axes are less controllable directions (Bottom Right).
that steers the initial zero state at infinite past to a point on the unit ball at t = 0 (Top). Moreover, this Gramian defines how inputs on the unit sphere (Bottom Left), such as noise or external signals, map to system states: Directions that are more controllable are characterized by elongated ellipsoidal axes, whereas the shortened axes are less controllable directions (Bottom Right).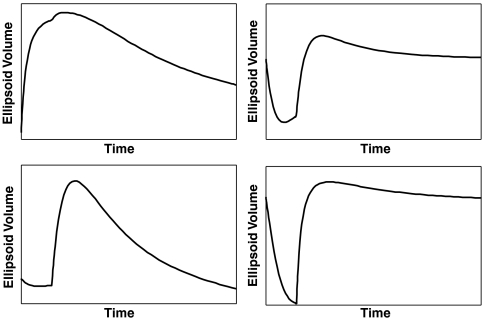
A control signal is introduced for a diffusion-like protocol on state-dependent weighted networks; the Euclidean distance matrices obtained from the experimental data are processed via a Euclidean embedding algorithm to obtain a realization for the network, which is then subjected to injected signal for the duration of 1 s. The controllability of the graph with respect to this input is then measured with respect to the two dominant directions over an interval. The network assumes a configuration that has a higher level of controllability with respect to the initial configuration, in direct correspondence with the metastable configuration during cell differentiation. Depending on the initial state of the nodes and their relative states with respect to the injected signal, the network’s controllability can assume distinct profiles: initial higher levels of controllability during the signal injection (Upper Left) as measured by the volume of the controllability ellipsoid in the two dominant directions, or initial lower levels of controllability followed by a higher level controllability (shown on the subsequent panels). The nonsmooth segment in each figure corresponds to the removal of injected signal.
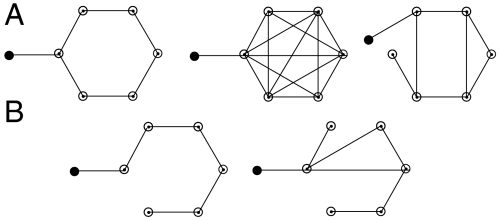
A network view of cellular reprogramming. Network diagrams A and B represent uncontrollable and controllable networks for the diffusion-like dynamics on graphs with one injected signal (black filled node).
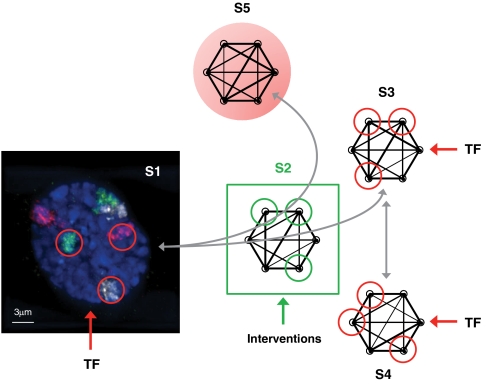
Control from a subset of nodes. With specific transcription factors (TF) as input signals, primary human fibroblasts (S1) transition to the metastable state (S2), where bifurcation takes place and two possible paths emerge. One leads to the normally specialized state (S3), and the other to an abnormally specialized state (S5). Under our hypothesis, interventions applied at S2 can influence the path taken. TF targeting a particular subset of nodes can also drive a transition from state S3 to another normally specialized state S4. The red and green circles denote the targeted nodes in each state.
Comment in
-
Mathematical controllability of genomic networks.Proc Natl Acad Sci U S A. 2011 Oct 18;108(42):17243-4. doi: 10.1073/pnas.1114108108. Epub 2011 Oct 10. Proc Natl Acad Sci U S A. 2011. PMID: 21987806 Free PMC article. No abstract available.
References
-
- Strogatz SH. Exploring complex networks. Nature. 2001;410:268–276. - PubMed
-
- Diestel R. Graph Theory. Heidelberg, Germany: Springer; 2000.
-
- Cook P. Predicting three-dimensional genome structure from transcriptional activity. Nat Genet. 2002;32:347–352. - PubMed
-
- Weintraub H. Assembly and propagation of repressed and derepressed chromosomal states. Cell. 1985;42:705–711. - PubMed
Publication types
MeSH terms
Substances
Grants and funding
LinkOut - more resources
Full Text Sources
Other Literature Sources
